SOVEREIGN EXECUTION FRAMEWORK RESTRICTED // SPEC-2026

THE IMPACT THEORY

Institutional Boundary Confluence and NY Open Trade Execution Protocols
Author: Impact
Target Asset: E-mini Nasdaq 100 (NQ)
Version: 1.0 (2026 Sovereign Edition)
Classification: Proprietary Matrix Framework
THE IMPACT DOCTRINE SECTION 00
"The retail trader searches for subjective patterns.
The sovereign operator executes off mathematical clearance boundaries."
— Impact
THE IMPACT THEORY PHASE I

CHAPTER 1:
THE SOVEREIGN STANDARD

LAGGING INDICATORS VS. BOUNDARY VECTORS
CHAPTER 01 // THE SOVEREIGN STANDARD PART 1.1

The Illusion of Free Indicators

If you are reading this, you have likely spent years chasing the holy grail of retail trading. You have loaded your charts with MACD crossovers, RSI overbought/oversold indicators, and exponential moving averages. You have consumed thousands of hours of YouTube content telling you that if you just wait for the moving averages to cross while the RSI is below 30, you will unlock financial freedom.

This is a calculated, systemic lie.

⚡ THE SYSTEMIC COUNTER-PARTY PARADOX

Retail indicators are engineered to concentrate retail liquidity into predictable zones. When millions of traders execute off the exact same lagging oscillator, they become the precise counter-party fuel required by institutional algorithms.
AUDIT METRICS RETAIL INDICATOR VULNERABILITY
94.8%
Retail Failure Rate with Lagging Indicators
Lagging
Calculation Engine (Past Closed Data)
Target Asset: E-mini Nasdaq 100 (NQ)
Primary Trap: RSI > 70 Overbought / MACD Cross
MM Action: Distribution into Retail Bids
Edge Factor: 0.00 (Zero Alpha / Pure Counter-Party)
CHAPTER 01 // THE SOVEREIGN STANDARD EXHIBIT 1.1

The Mathematics of Exit Liquidity

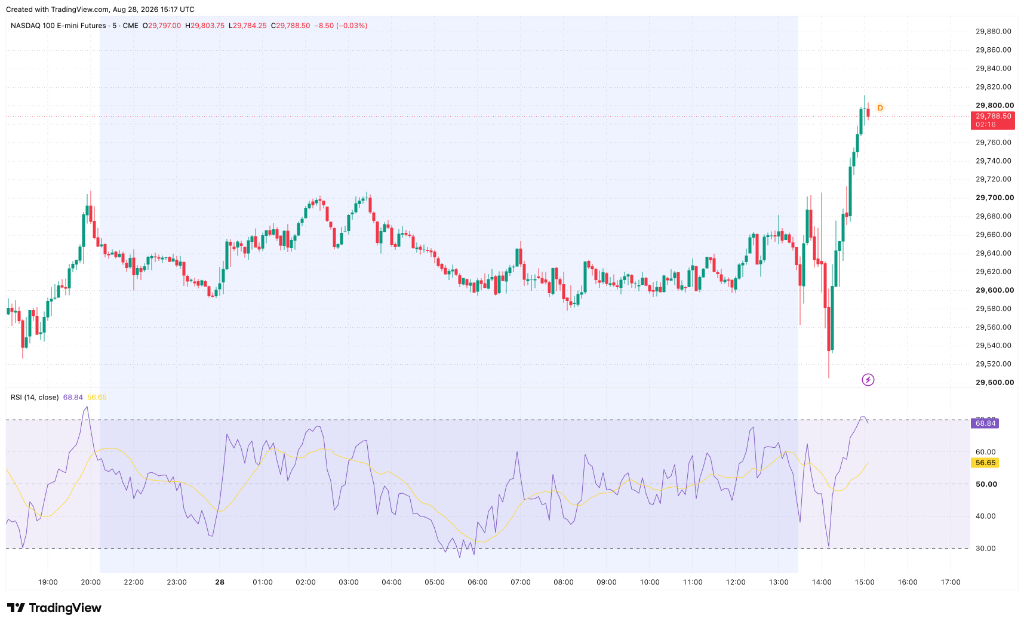
You must understand the mathematical reality of the tools you have been taught to use. Indicators like the MACD and RSI are derivative, lagging formulas. They are calculated based on historical, closed price data. They tell you what the market did, not what the market must do.

By the time a retail oscillator processes data, draws a line on screen, and signals a "buy," institutional algorithms have already distributed risk. Smart money entered minutes prior, and now uses retail "buy" orders as the exit liquidity required to close massive positions and reverse the market.

When you trade retail indicators, you are not outsmarting the market. You are providing market makers with a counter-party to absorb risk at pre-programmed sweep levels.

NQ1! • 5m • RETAIL OSCILLATOR AUDIT
EXHIBIT 1.1
Exhibit 1.1
EXHIBIT 1.1 // LAGGING TRAP: Retail oscillator printing late overbought signals into institutional liquidity.
CHAPTER 01 // THE SOVEREIGN STANDARD PART 1.3

The Neurological Reprogramming

To survive, scale, and extract liquid capital from highly efficient, predatory environments like the Nasdaq (NQ), you must undergo a complete neurological reprogramming.

You must stop trading what you think, what you feel, or what a lagging line tells you. You must transition from a subjective artist looking at patterns into a clinical engineer executing strictly off predefined, mathematical, institutional-grade boundaries.

This protocol document outlines my exact, proprietary edge—the Impact Theory. It is the product of thousands of hours of screen time, raw market data audits, and the code behind my private chart-plotting matrix. It is the bridge between retail guessing and institutional knowing.

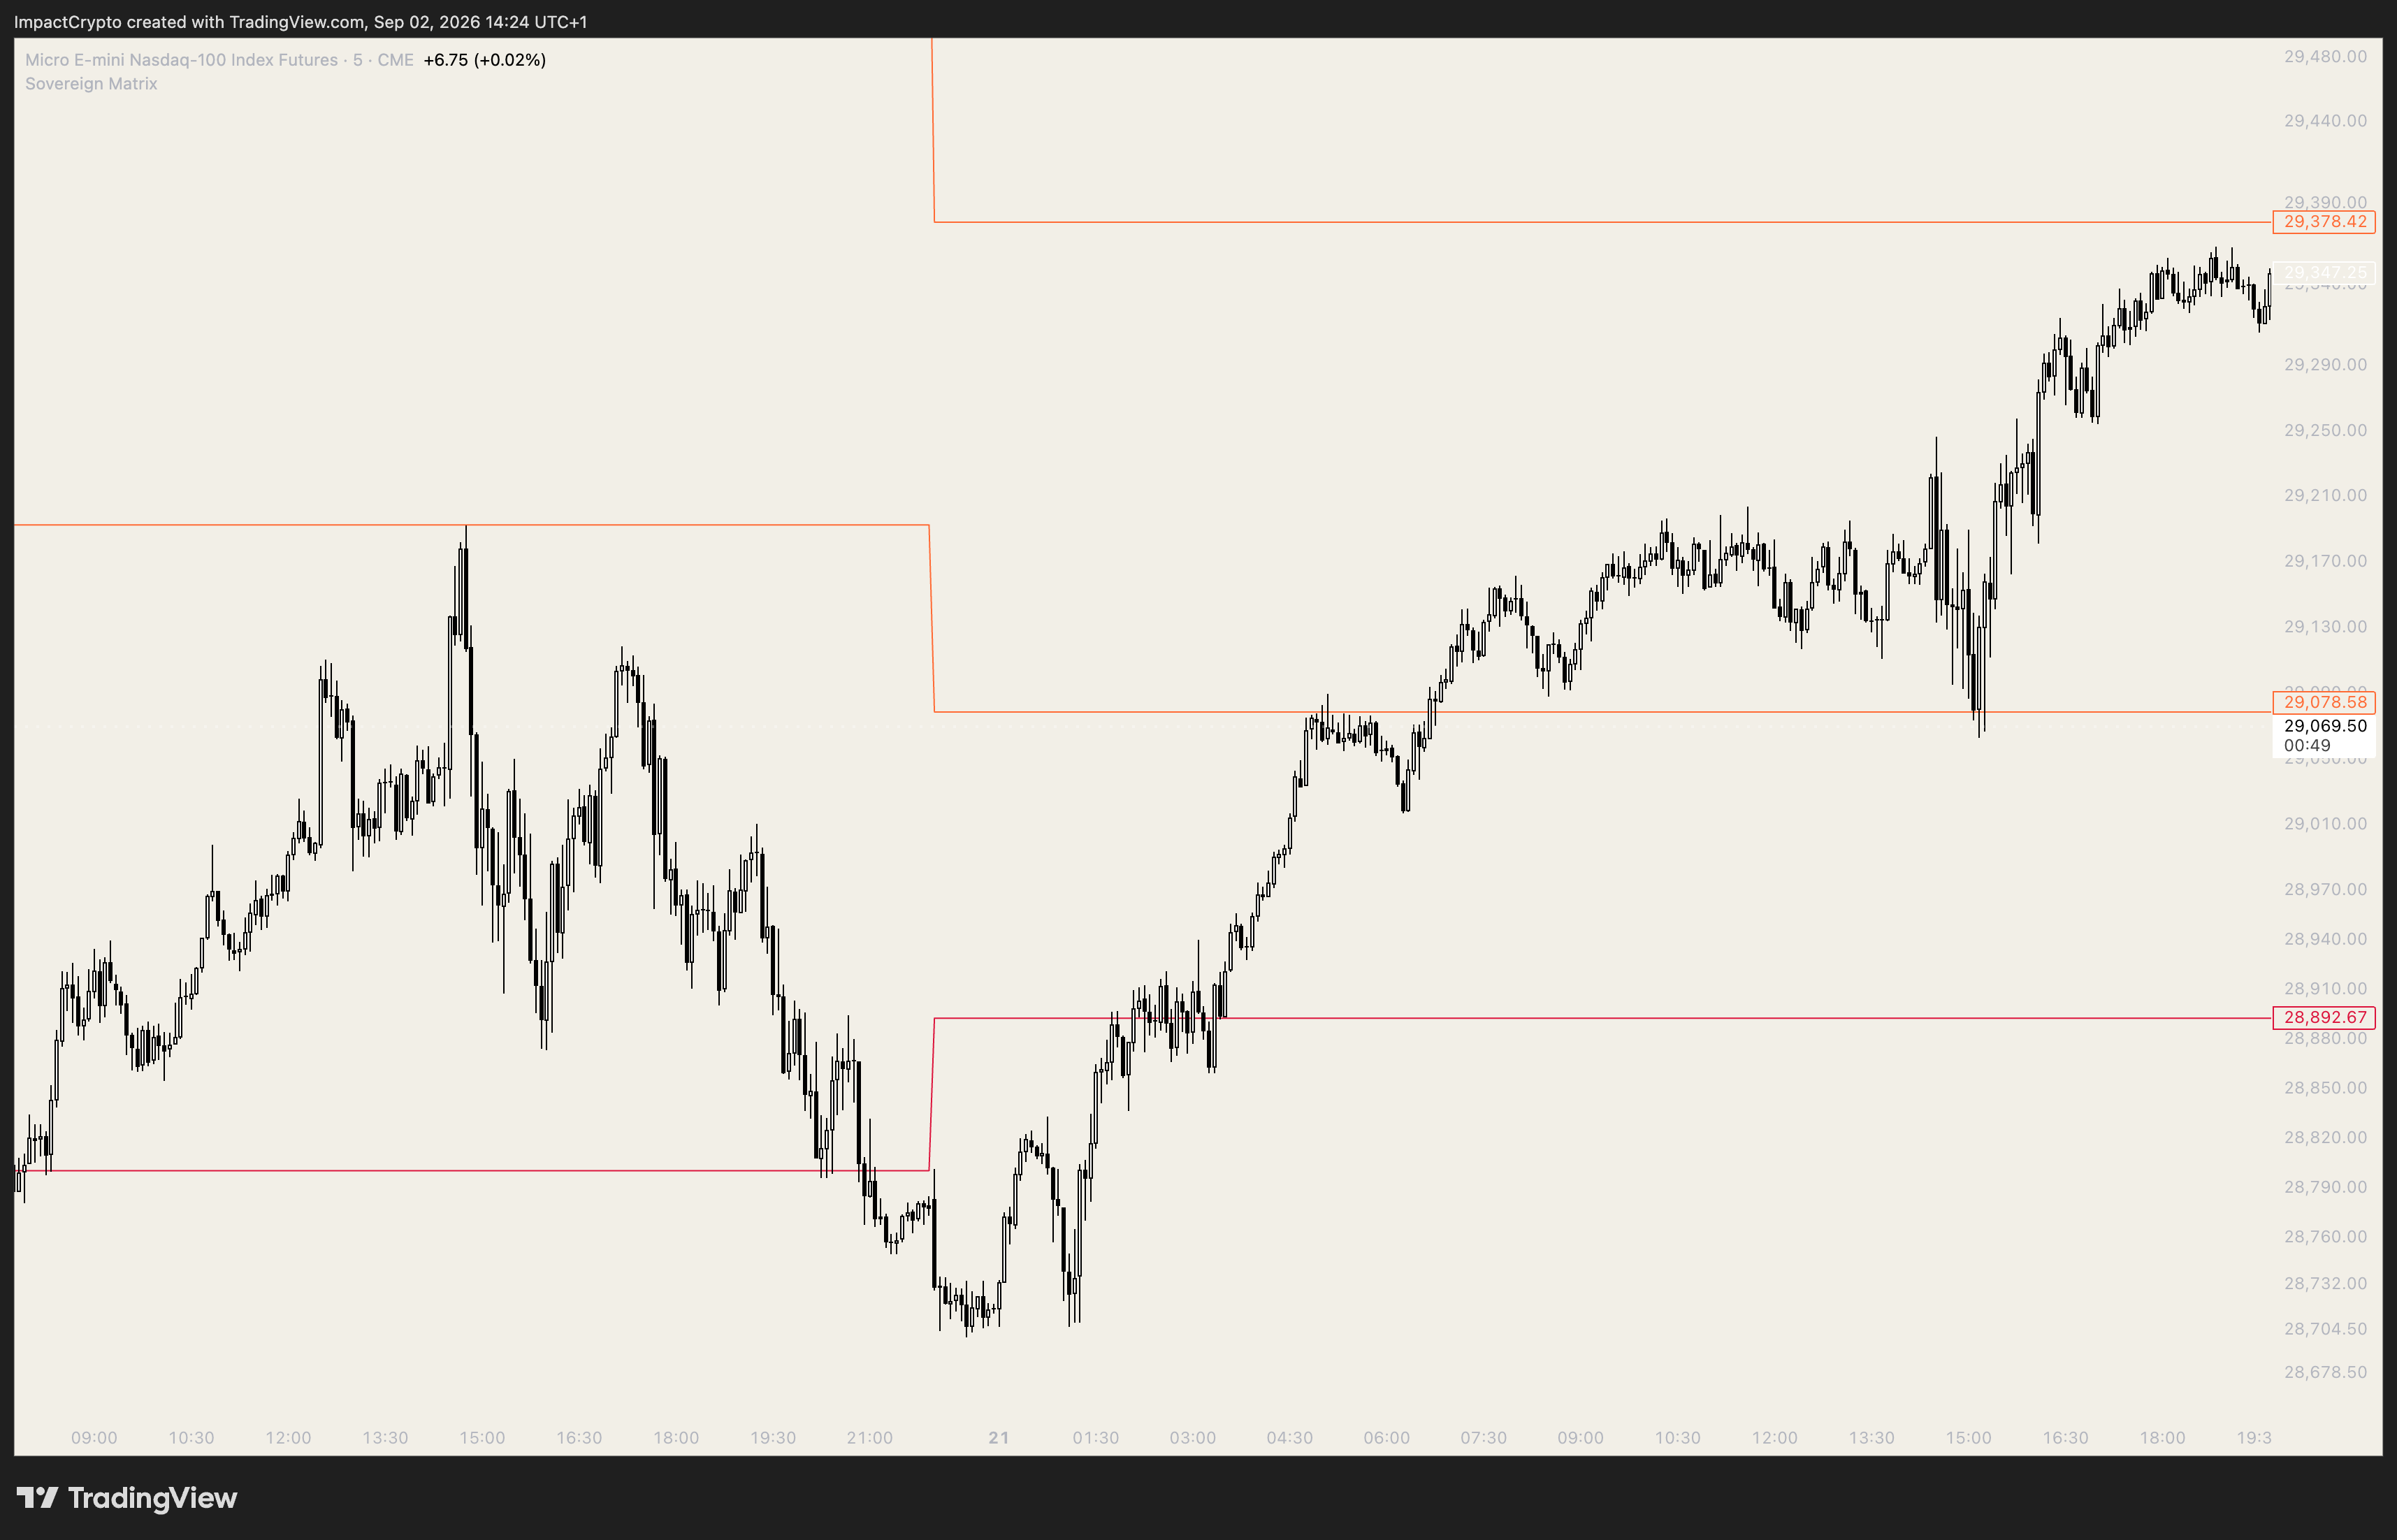
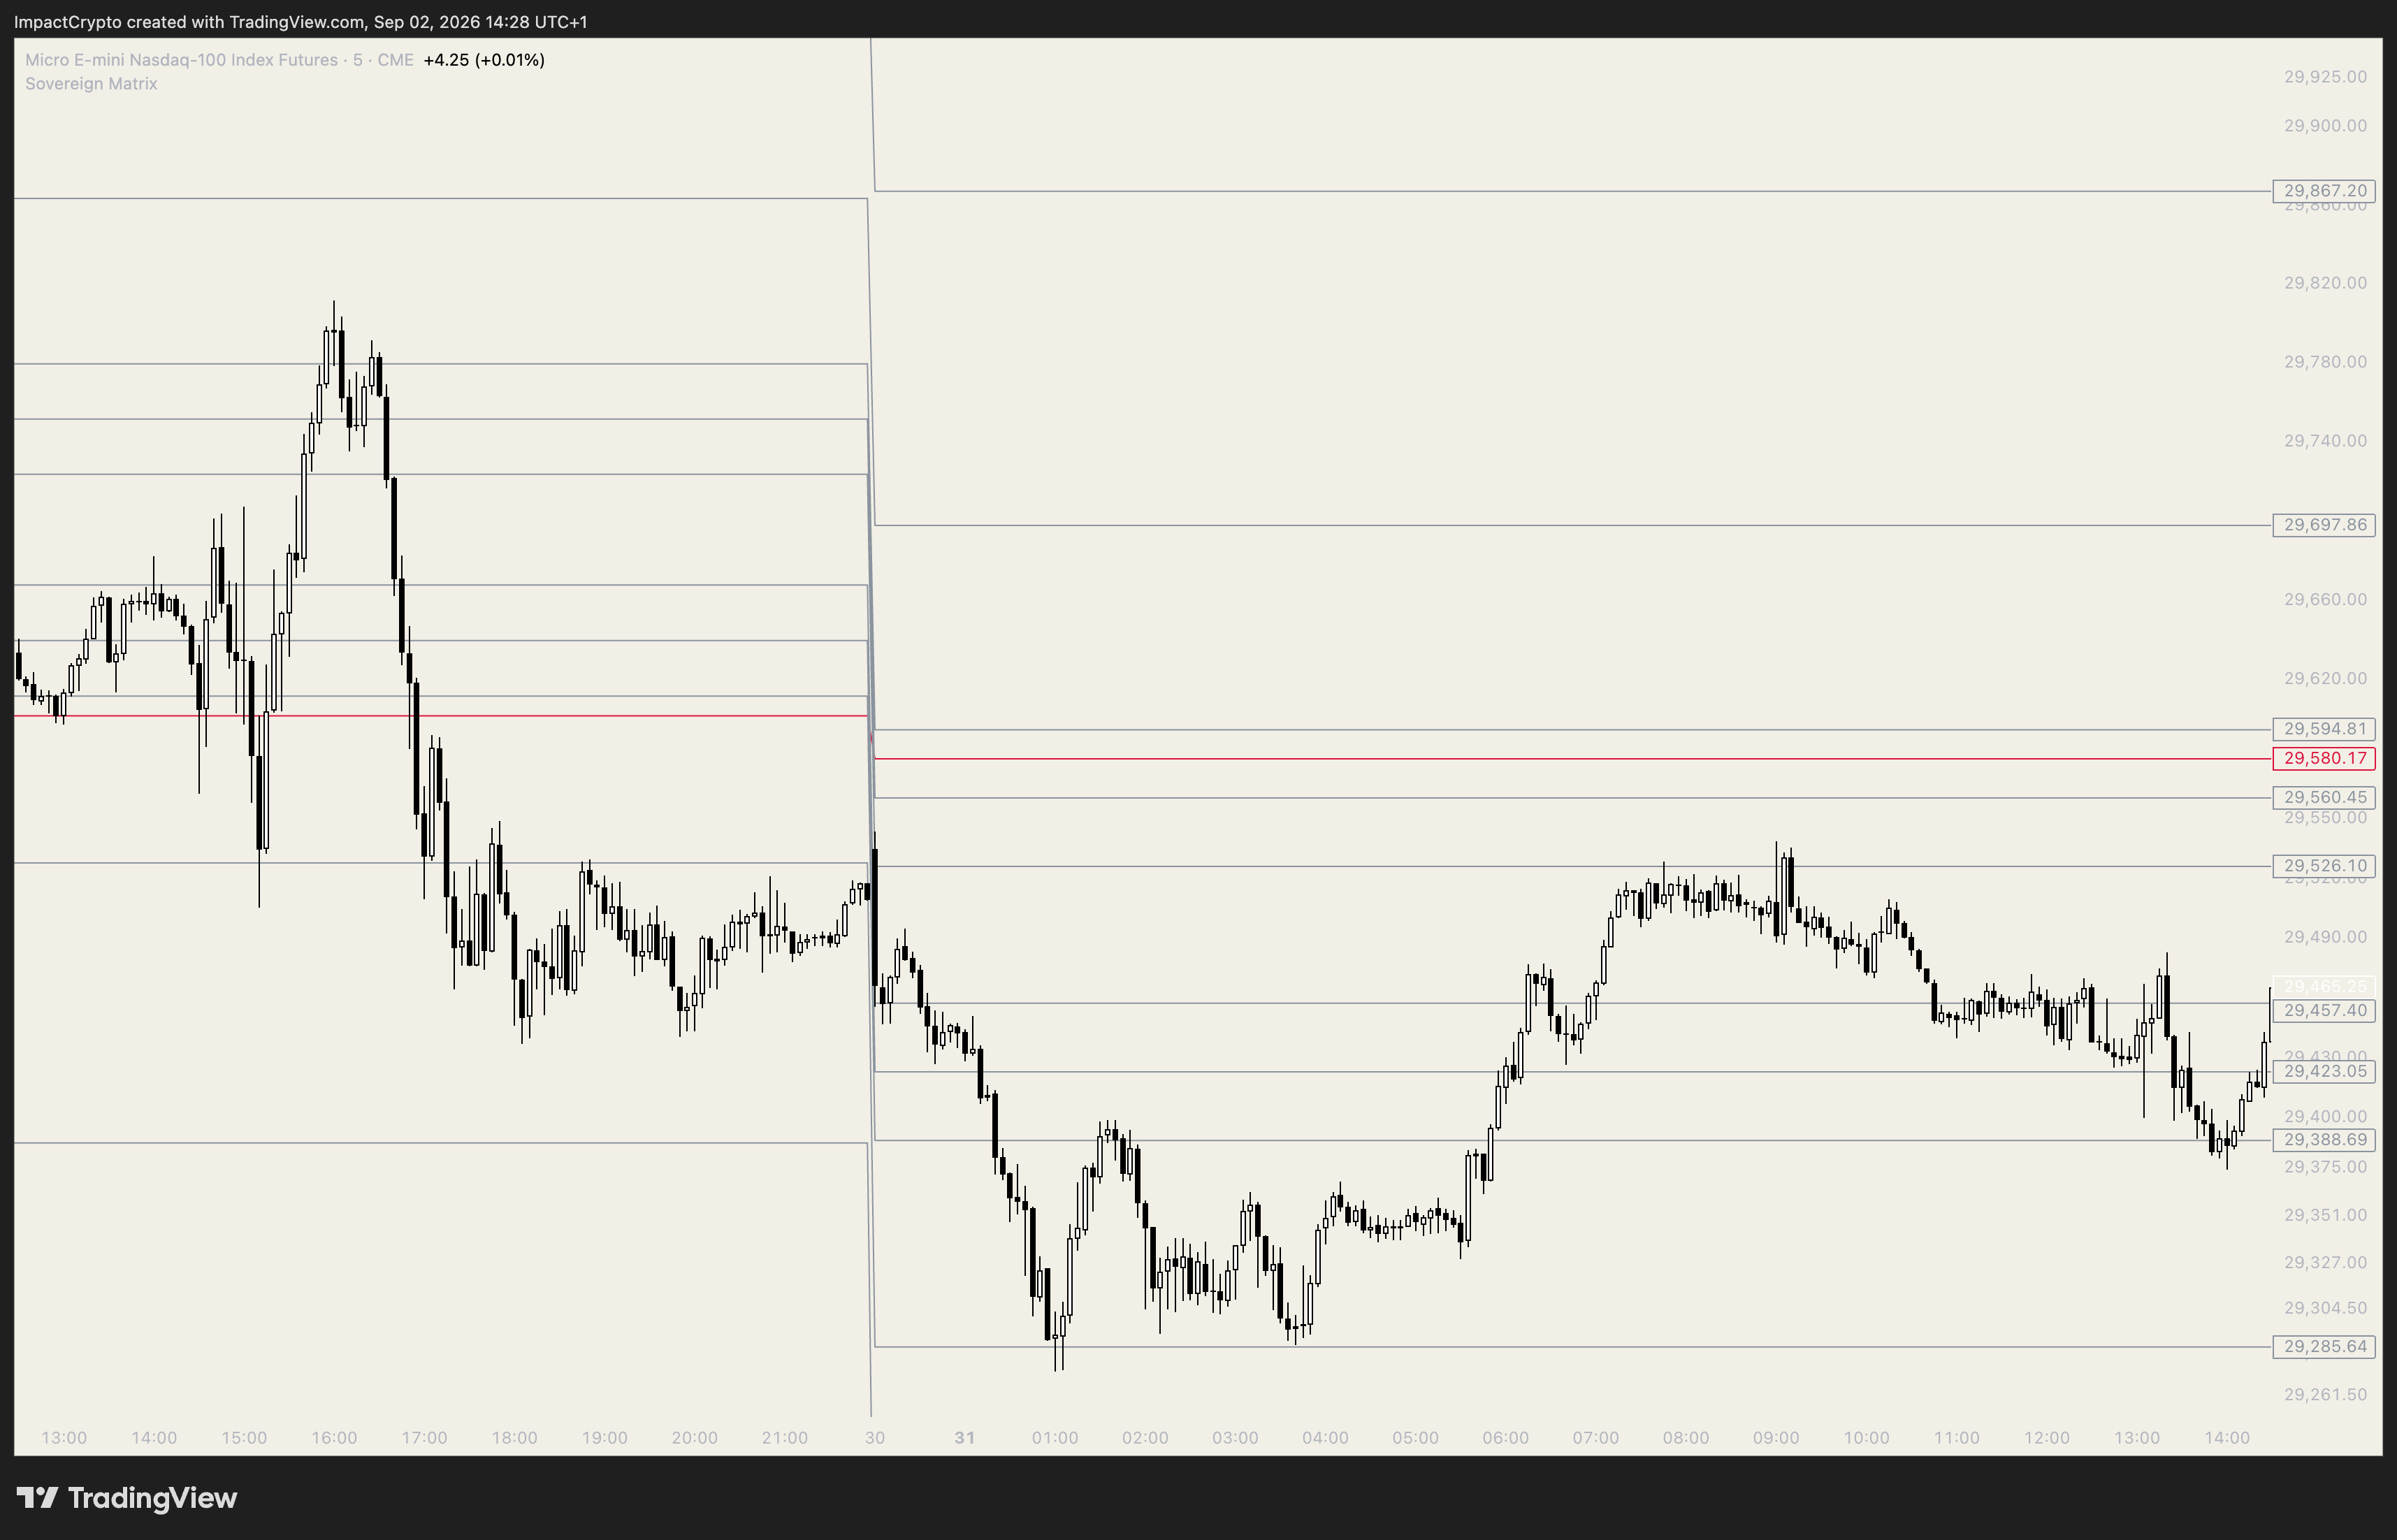
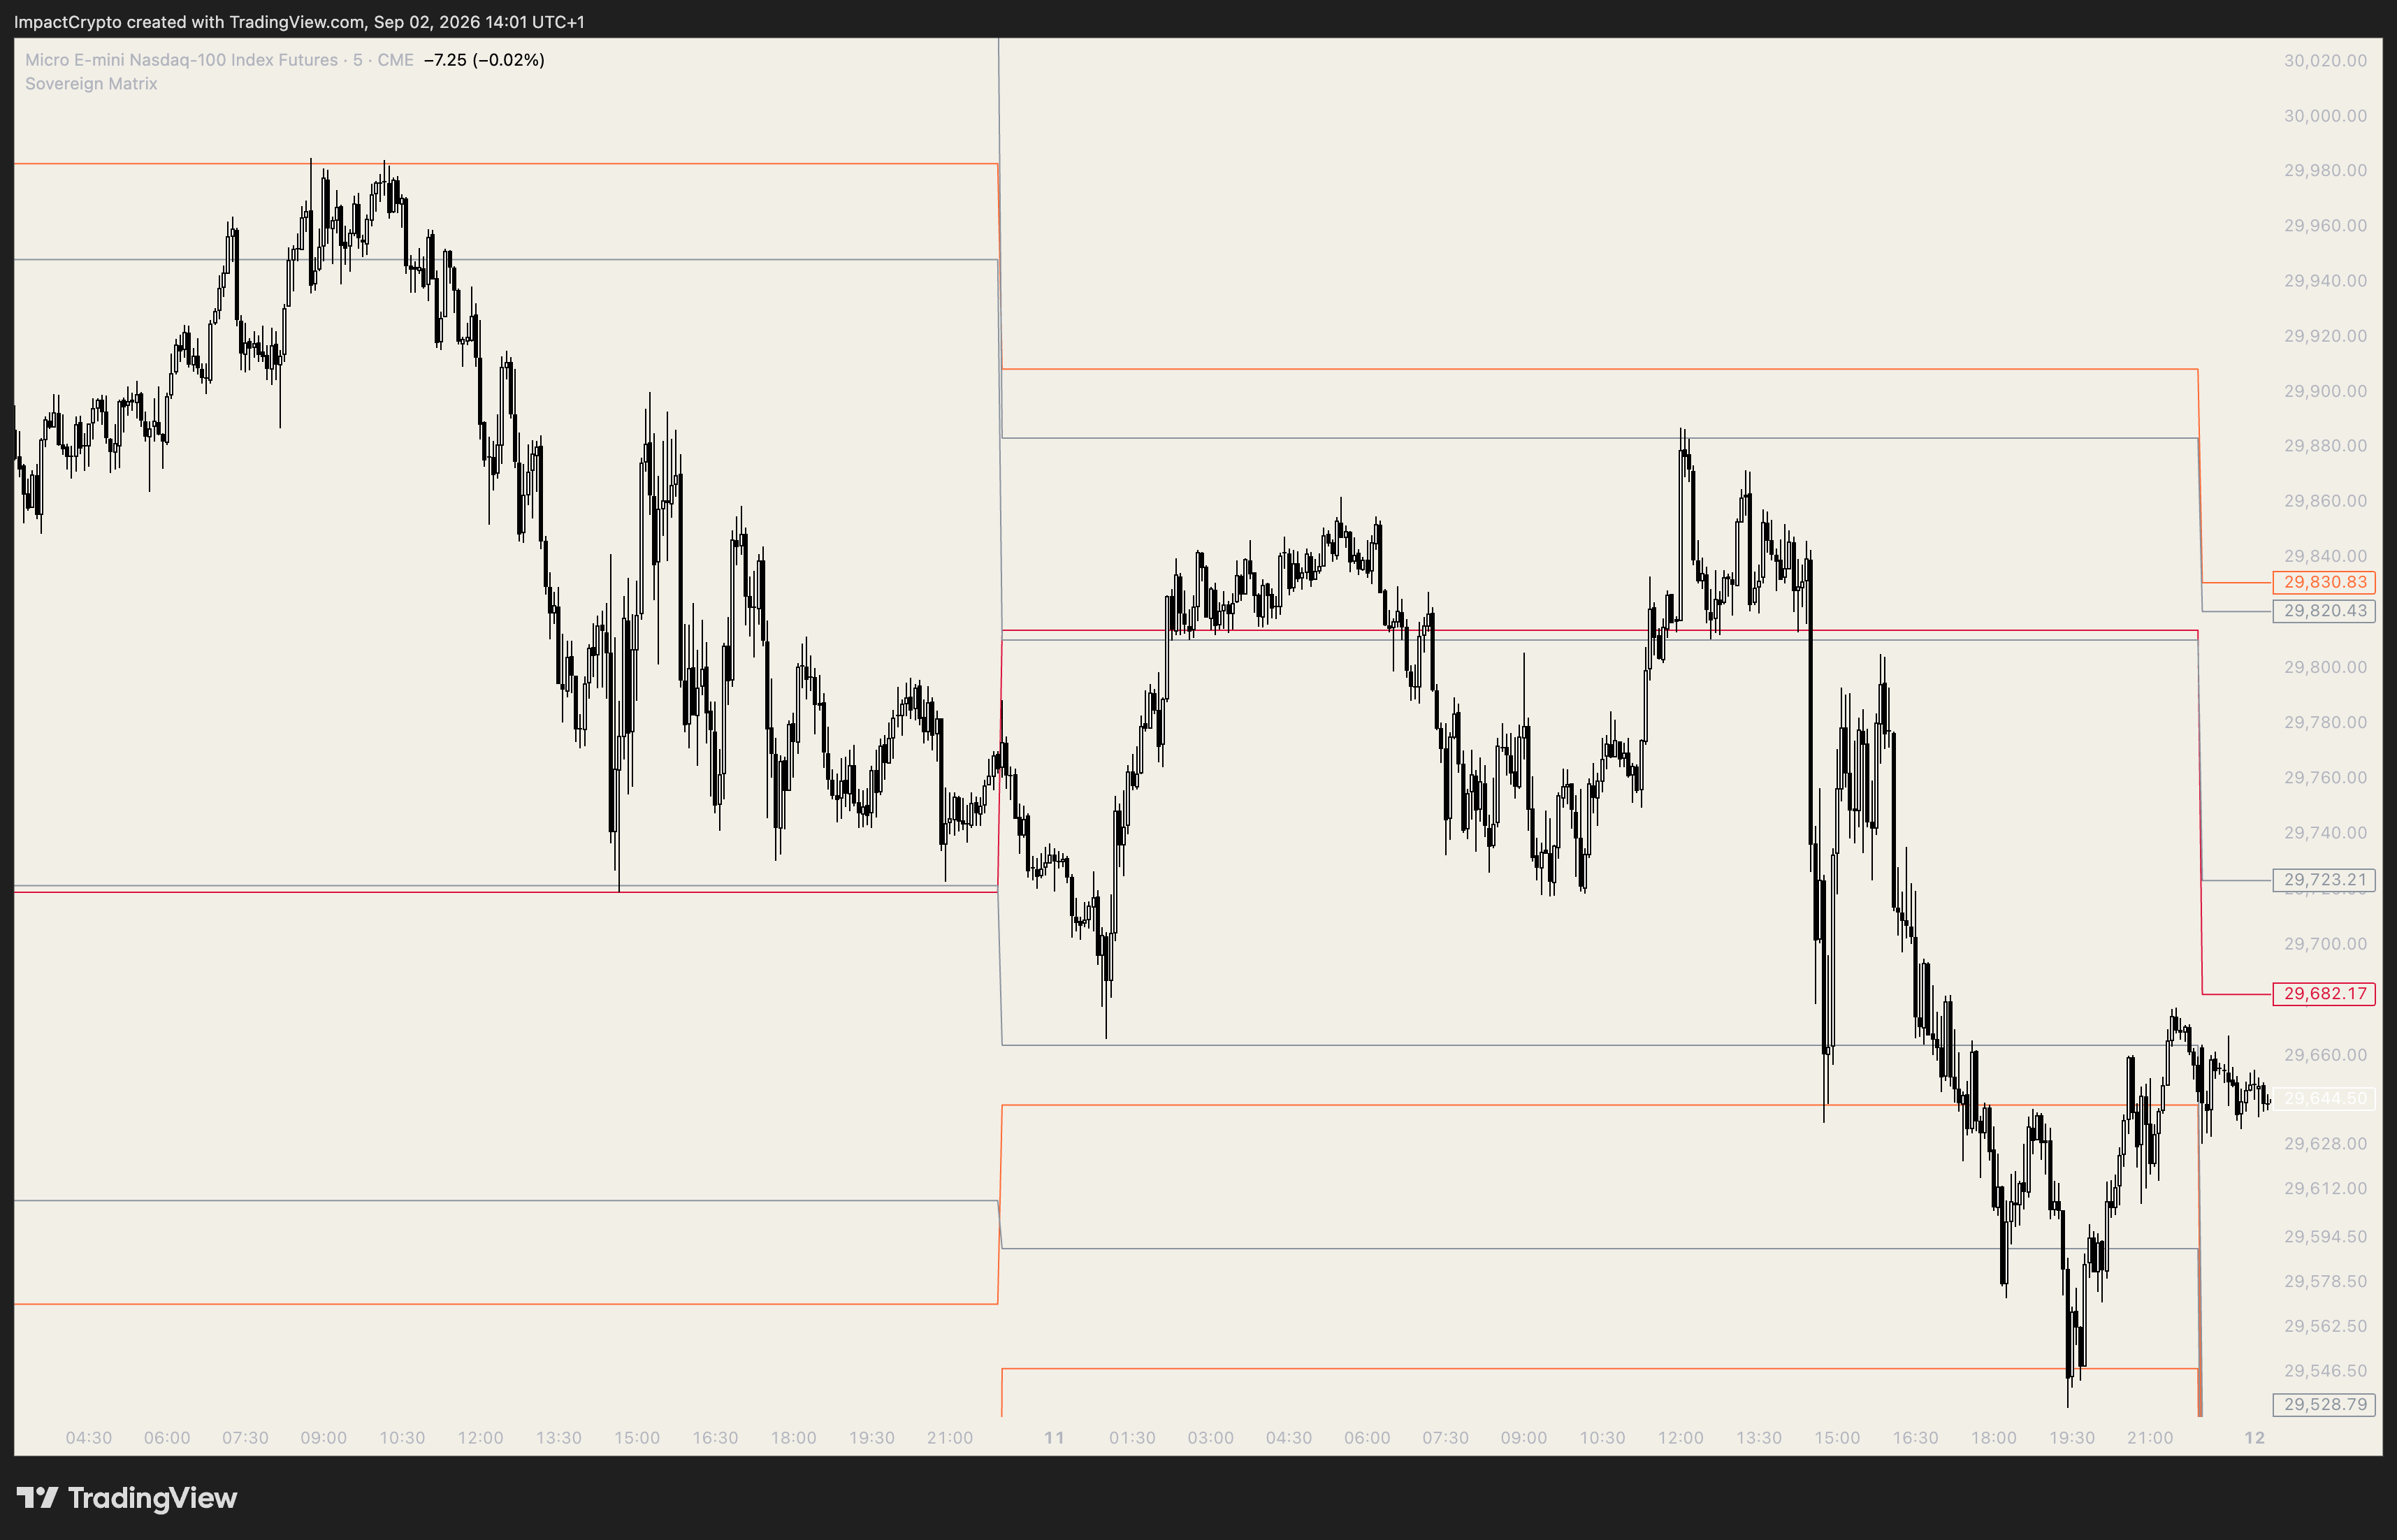
SOVEREIGN MATRIX // 5M NQ ARCHITECTURE
MATRIX V4.2
Impact Clean Matrix
THE SOVEREIGN STANDARD: Clinical, mathematical boundaries replacing subjective retail noise.
THE IMPACT THEORY PHASE II

CHAPTER 2:
THE ARCHIVE PROTOCOL

2022 BYBIT PROVENANCE & DORM LOCKDOWN
CHAPTER 02 // THE ARCHIVE PROTOCOL PART 2.1

The Sovereign Standard

Before we analyze the mathematical rules of our institutional boundaries, we must address a critical question: Why should you listen to me?

In the modern trading landscape, the barrier to entry is zero. Anyone can purchase a white-labeled indicator, rent a sports car for a weekend, and launch a social media account claiming they have the "secret" to the markets. They speak in vague generalities, hide daily losses, and show zero historical footprint of surviving market cycles.

I do not operate under the "guru" paradigm. I operate under the Sovereign Standard.

My edge was forged under extreme pressure over years of brutal market cycles, starting in the wild-west leverage environments of cryptocurrency, and refined through years of daily execution while balancing a top-tier academic workload.

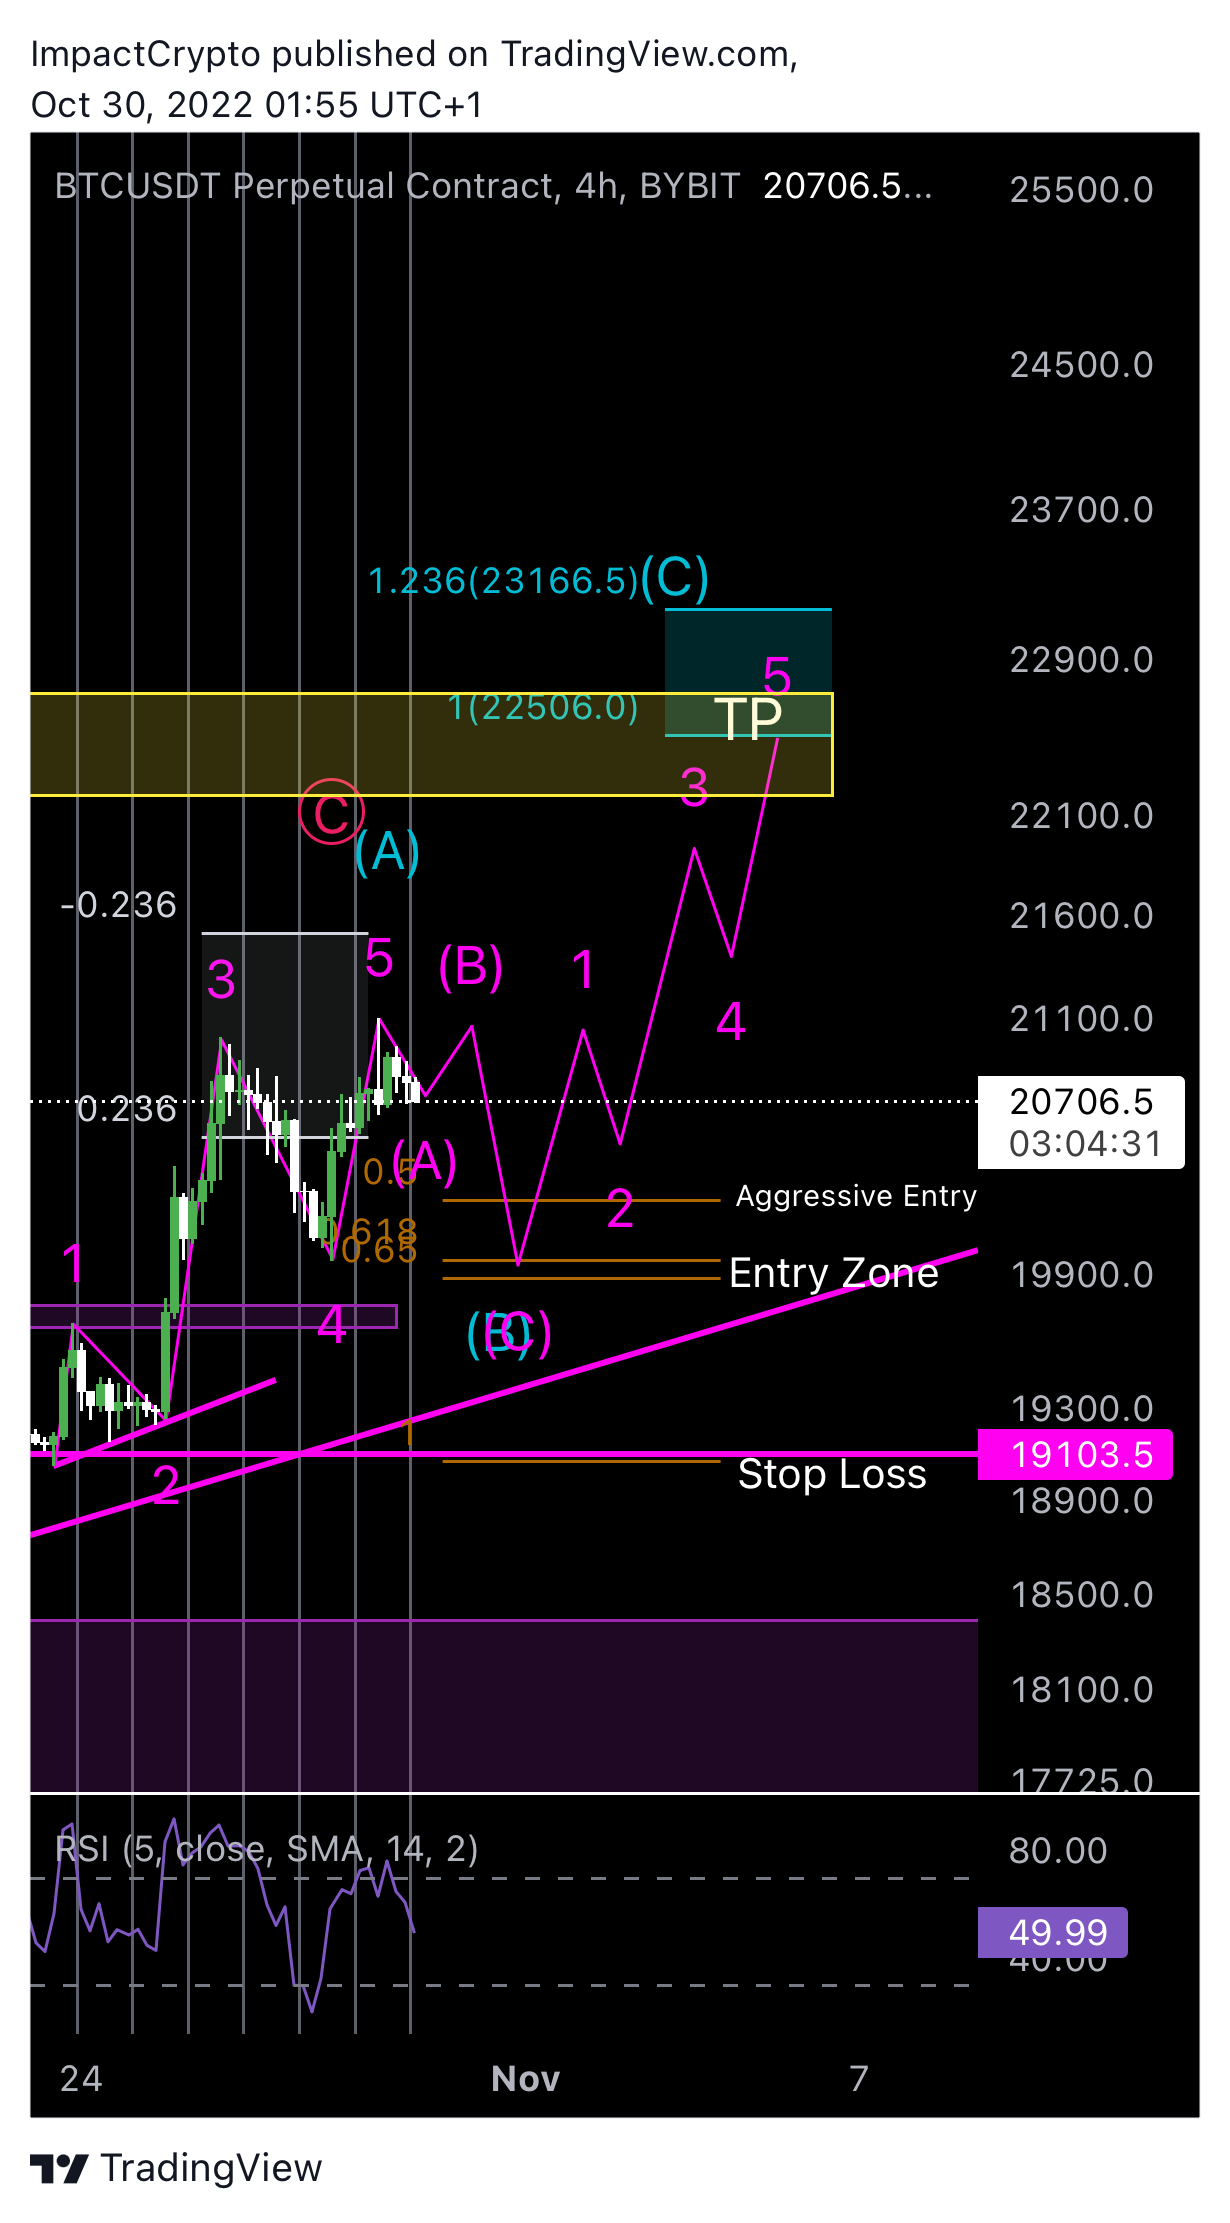
Bybit Crypto Archive
HISTORICAL ARCHIVE
BTCUSDT BYBIT DERIVATIVES (OCT 2022)

Early mobile execution mapping Elliott Wave cycles and geometric wave extensions on Bybit derivatives—the foundational step in uncovering the mathematical principles behind institutional market boundaries.

CHAPTER 02 // THE ARCHIVE PROTOCOL PART 2.2

Phase 1: The Crypto Trenches

Long before I traded institutional futures, my initiation into market mechanics began in the most volatile asset class on earth: Cryptocurrency (circa 2022).

While my peers in college were focused on social validation and weekend parties, my bedroom was a localized data center. I sat in my study room with multiple monitors, mapping intricate Elliott Wave structures and calculating geometric Fibonacci expansions. I had raw pattern recognition and an obsessive drive to master the mathematical order hidden beneath market volatility.

Alongside digital charts, I ran an active physical reselling business. This was a real-world sandbox for economic theory, testing supply-demand friction, speed-to-market, and systemic arbitrage. It proved a universal truth: Any market, whether physical goods or financial assets, always settles at extreme structural boundaries when liquidity dries up.

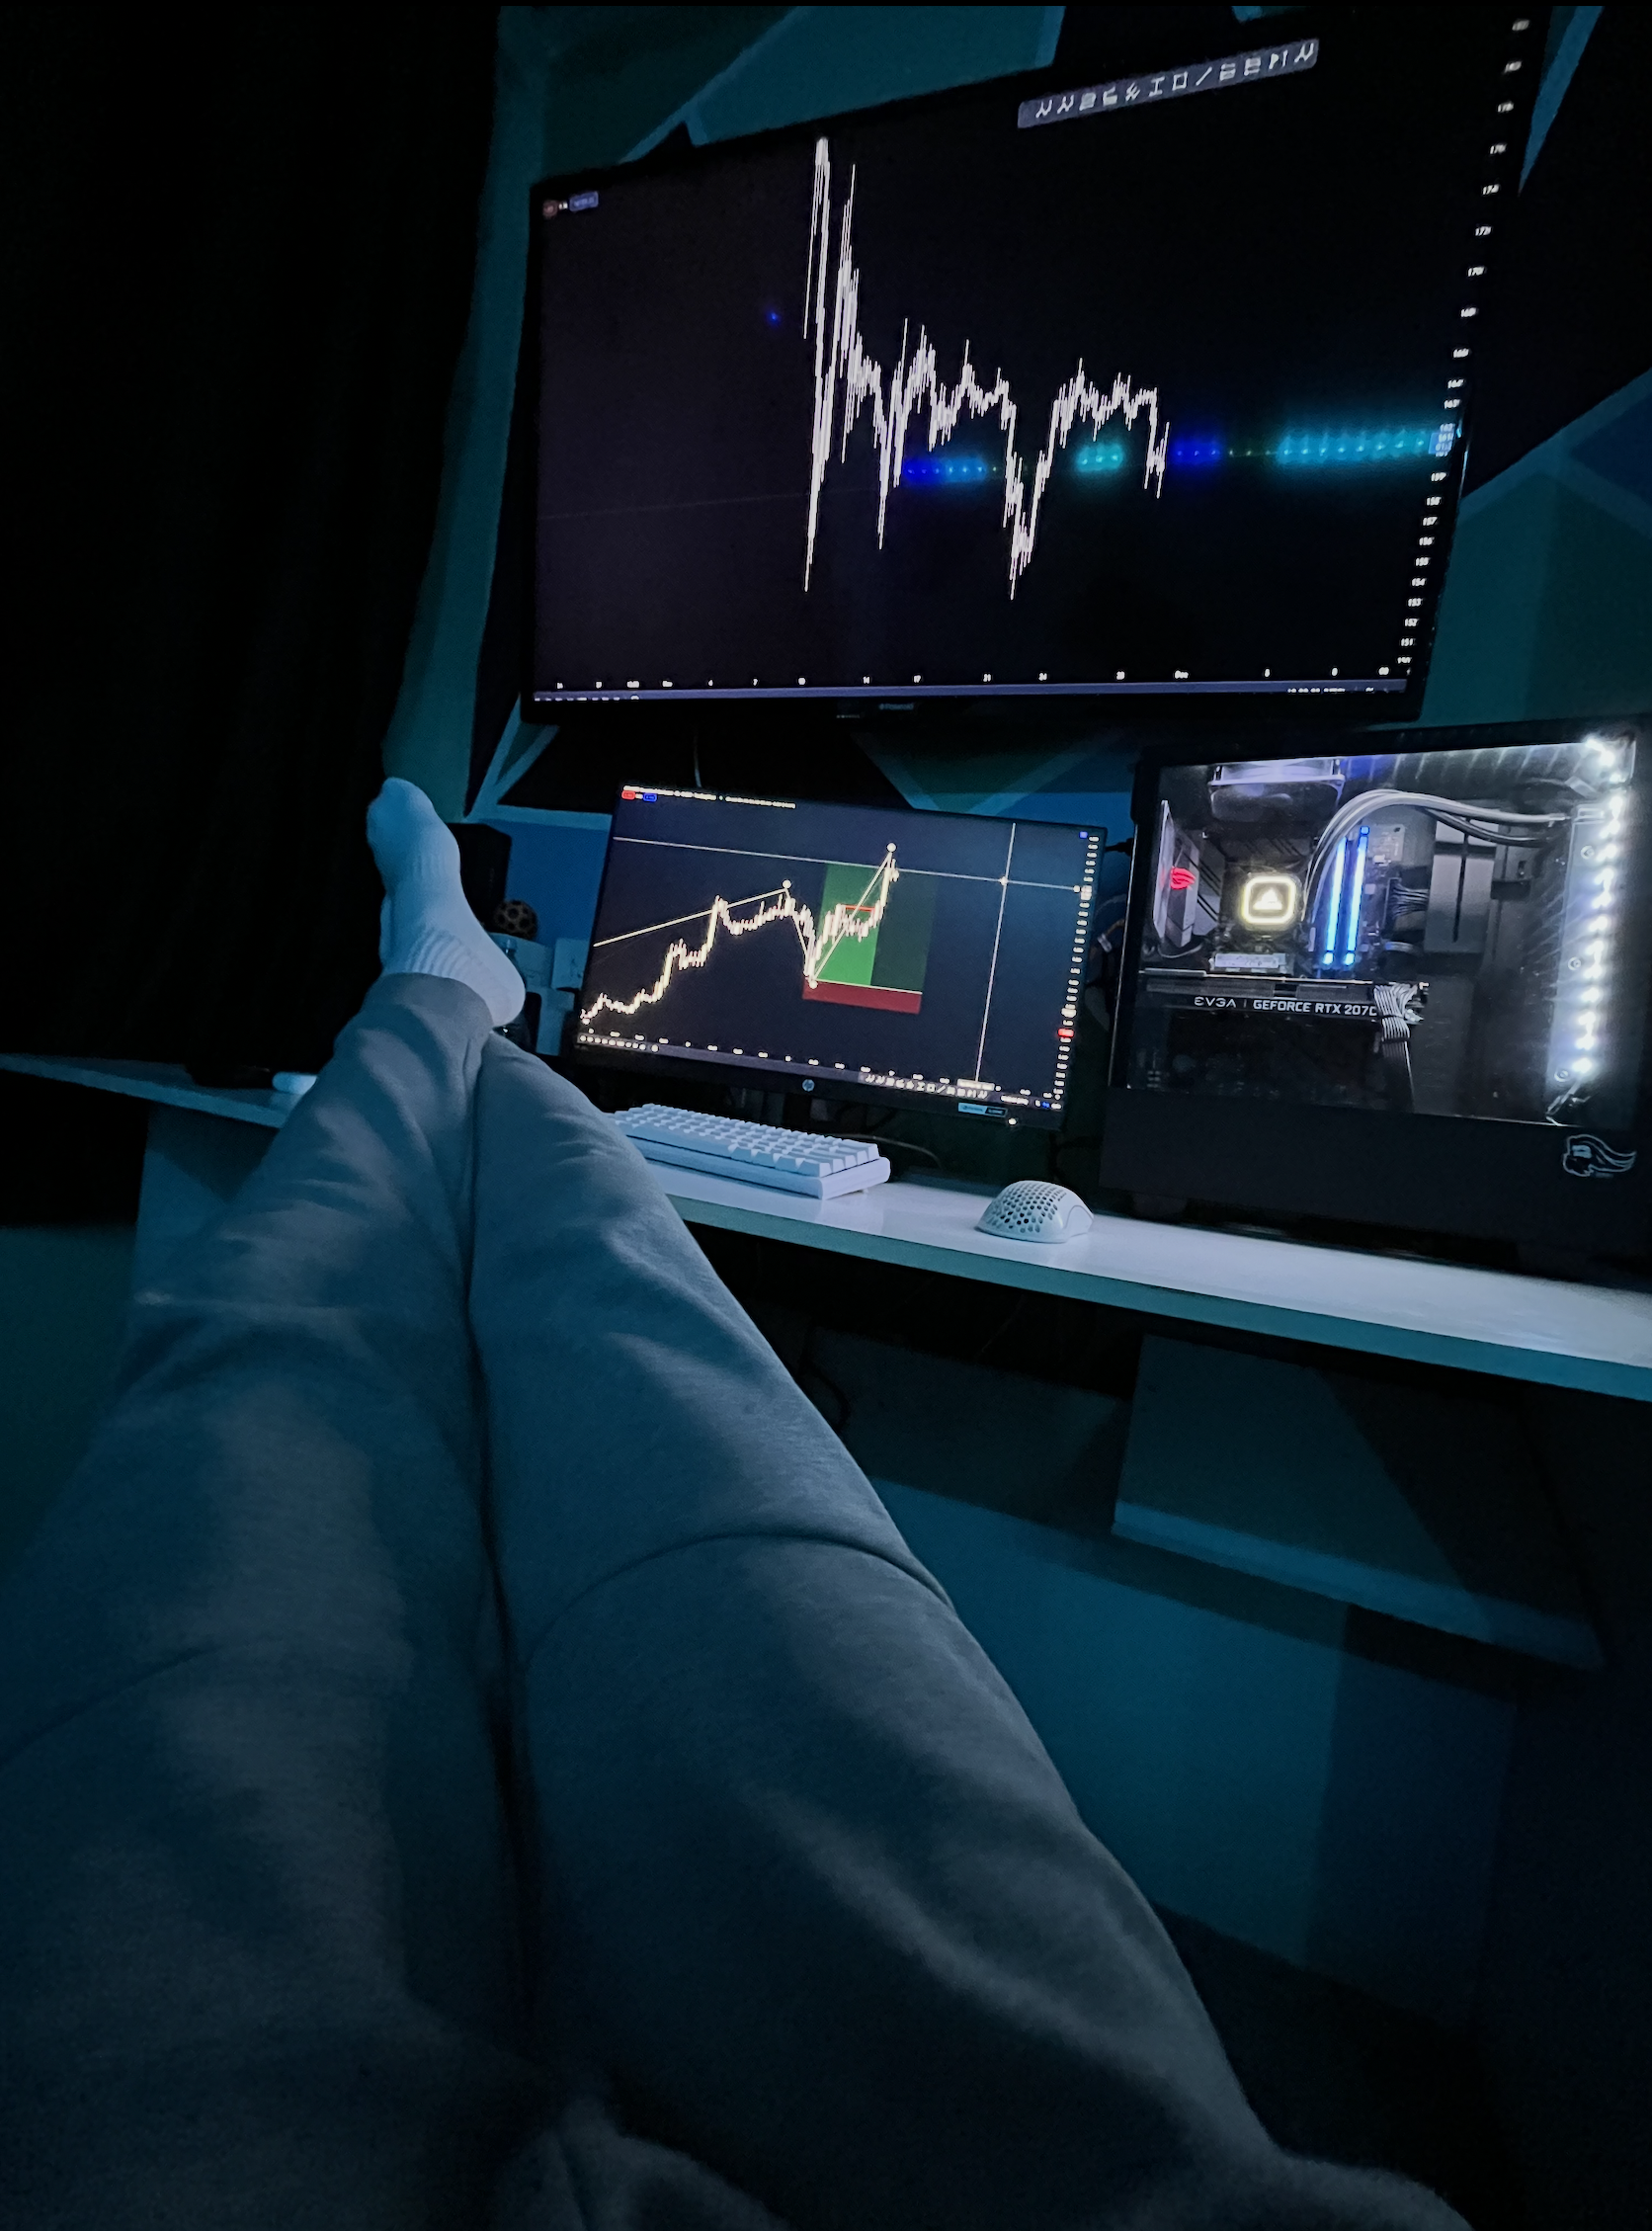
WORKSTATION STAGING // DORM SETUP
2022–2023
Dorm Workstation
UNIVERSITY DORM STAGING: Confluence backtesting and Pine Script logic engineering (2022–2023).
CHAPTER 02 // THE ARCHIVE PROTOCOL PART 2.3

The Aerospace Engineering Mindset

Despite pouring my obsession into dual ventures, my academic performance compounded. I scored the highest marks in engineering that my college had seen in a very long time, securing my spot at one of the Top 5 Universities in the country for Aerospace Engineering.

In aerospace engineering, an aircraft wing has a strict mathematical load boundary. If stress exceeds that boundary, the wing experiences catastrophic structural failure. Financial markets operate under the exact same physics: price cannot expand infinitely without encountering mathematical structural resistance.

This led to the legendary Library Siege, where a crowd of over 30 students surrounded my desk in the university library watching live derivative mathematical mapping until security intervened.

LIVE ACADEMIC LAB EXECUTION
RECORDED PROOF
Academic Lab Execution
THE LIBRARY SIEGE: Executing live derivative models on institutional hardware during university hours.
MANDATORY DISCLAIMER FILTER PROTOCOL

THE VELVET ROPE:
A WARNING TO SLACKERS

Before we go any further into the mathematics, I need to make something brutally clear.

The systems and boundary equations outlined in this document are highly effective, but they are not a "get-rich-quick" cheat code for lazy people. I have only ever taught full-time, hardworking operators who possessed the discipline to take this data, execute the rules, and treat trading like a serious profession.

Everyone else who looks for magic indicators without risk management ends up as exit liquidity. If you are a slacker, if you lack the discipline to follow strict rules, or if you are looking for an easy handout, DO NOT enter our community.

SOVEREIGN ENTRY GATE FINAL FILTER
Close this page, delete this file, and do not enter the War Room.
We do not allow slackers, and we do not compromise on the standard.
If you are still here, and you are ready to apply engineering-grade precision to the charts, turn the page.
THE IMPACT THEORY PHASE III

CHAPTER 3:
LEVEL ARCHITECTURE

CENTRAL EQUILIBRIUM, BV SUPPORT/RESISTANCE, CLEARANCE VECTORS
CHAPTER 03 // LEVEL ARCHITECTURE PART 3.1

The Structural Matching Engine

The market is not a chaotic, random walk of buyers and sellers. It is a highly structured, algorithmic matching engine designed to manage and hedge massive, systemic options risk.

When institutional market makers write option contracts, they accumulate localized "gamma" and "delta" risk. To keep their billion-dollar books neutral and avoid catastrophic losses, their algorithms continuously buy or sell underlying assets (such as Nasdaq futures) as price crosses specific, mathematically derived price points.

The Sovereign Matrix operates symmetrically. Price oscillates around the Central Equilibrium (CE), distributing into BV Resistance (BV-R1 through BV-R3) and accumulating at BV Support (BV-S1 through BV-S3). Every profile applies bi-directionally: long entries execute at structural support floors; short entries execute at structural resistance ceilings.

[ THE INSTITUTIONAL BOUNDARY STACK ]
CV-R5 / CV-S5:
Clearance Vectors (+/-4.5 SD Node)
➔ Extreme Capitulation
BV-R1 / BV-S1:
Boundary Vectors (+/-2.0 to 2.5 SD Limit)
➔ Reversion Triggers
Central Equilibrium (CE):
The Fair Value Magnet
➔ Natural Target
CHAPTER 03 // LEVEL ARCHITECTURE PART 3.2

Boundary Vectors (BV-R / BV-S)

To prevent retail copycats from reverse-engineering our database, we translate our mathematical indicators into clean, high-density vector notations. Think of these as the structural load-bearing limits of an aircraft wing:

  • Central Equilibrium (CE): The absolute gravitational center of the session. Represents the net-neutral hedging balance point. Price is magnetically drawn back to CE during balanced rotations.
  • BV-R1 / BV-S1 (Primary Vectors): Define the primary Value Area boundary (+/-2.0 to 2.5 SD). Watched closely for early session reversion setups.
  • BV-R2 / BV-S2 (Fatigue Vectors): Strong structural friction points where institutional order flow encounters counter-liquidity.
  • BV-R3 / BV-S3 (Exhaustion Limits): Rare outer structural boundaries holding highest historical mean-reversion probability.
BOUNDARY VECTORS // SYMMETRIC MAP
BV ARRAY
Boundary Vectors Map
BOUNDARY VECTORS (BV): Multi-day structural load limits scaling across BV Support (BV-S) and Resistance (BV-R) from CE.
CHAPTER 03 // LEVEL ARCHITECTURE PART 3.3

The Clearance Vectors (CV-R / CV-S)

Clearance Vectors track intraday rate-of-change models, delta-hedging walls, and critical acceleration or trap zones:

  • CV-R1 & CV-R2 / CV-S1 & CV-S2 (Minor Reversion Nodes): Used primarily to scale runner positions and identify minor intraday rotation targets.
  • CV-R3 / CV-S3 (The Balance Threshold): Boundary of standard intraday rotation. Clean reversals during balanced sessions.
  • CV-R4 / CV-S4 (The Acceleration Vector): If price breaks this level with institutional volume, algorithms switch into "Trend Acceleration" mode.
  • CV-R5 / CV-S5 (The Capitulation Node): Absolute statistical boundary of daily volatility (+/-4.5 SD). Massive retail stop cascades occur here—our primary zone for zero-drawdown generational reversals.
CLEARANCE VECTORS // VELOCITY TIERS
CV ARRAY
Clearance Vectors Map
CLEARANCE VECTORS (CV): Dynamic rate-of-change boundaries mapping intraday capitulation and exhaustion nodes.
THE IMPACT THEORY PHASE IV

CHAPTER 4:
THE OPERATIONAL WORKFLOW

PRE-MARKET PROTOCOL & MARKET MODES
CHAPTER 04 // OPERATIONAL WORKFLOW PART 4.1

The Pre-Market Protocol

Every morning at exactly 8:00 AM UK time, we execute the Pre-Trade Filter to identify session Expected Value:

Step 1: The Macro News Audit
• Red Folder: Extreme volatility (CPI, FOMC, NFP). Flat 15 min before/after.
• Orange Folder: Medium impact. High-volume sweeps into Fatigue Vectors.
• Yellow Folder: Low impact. Standard geometric execution applies.

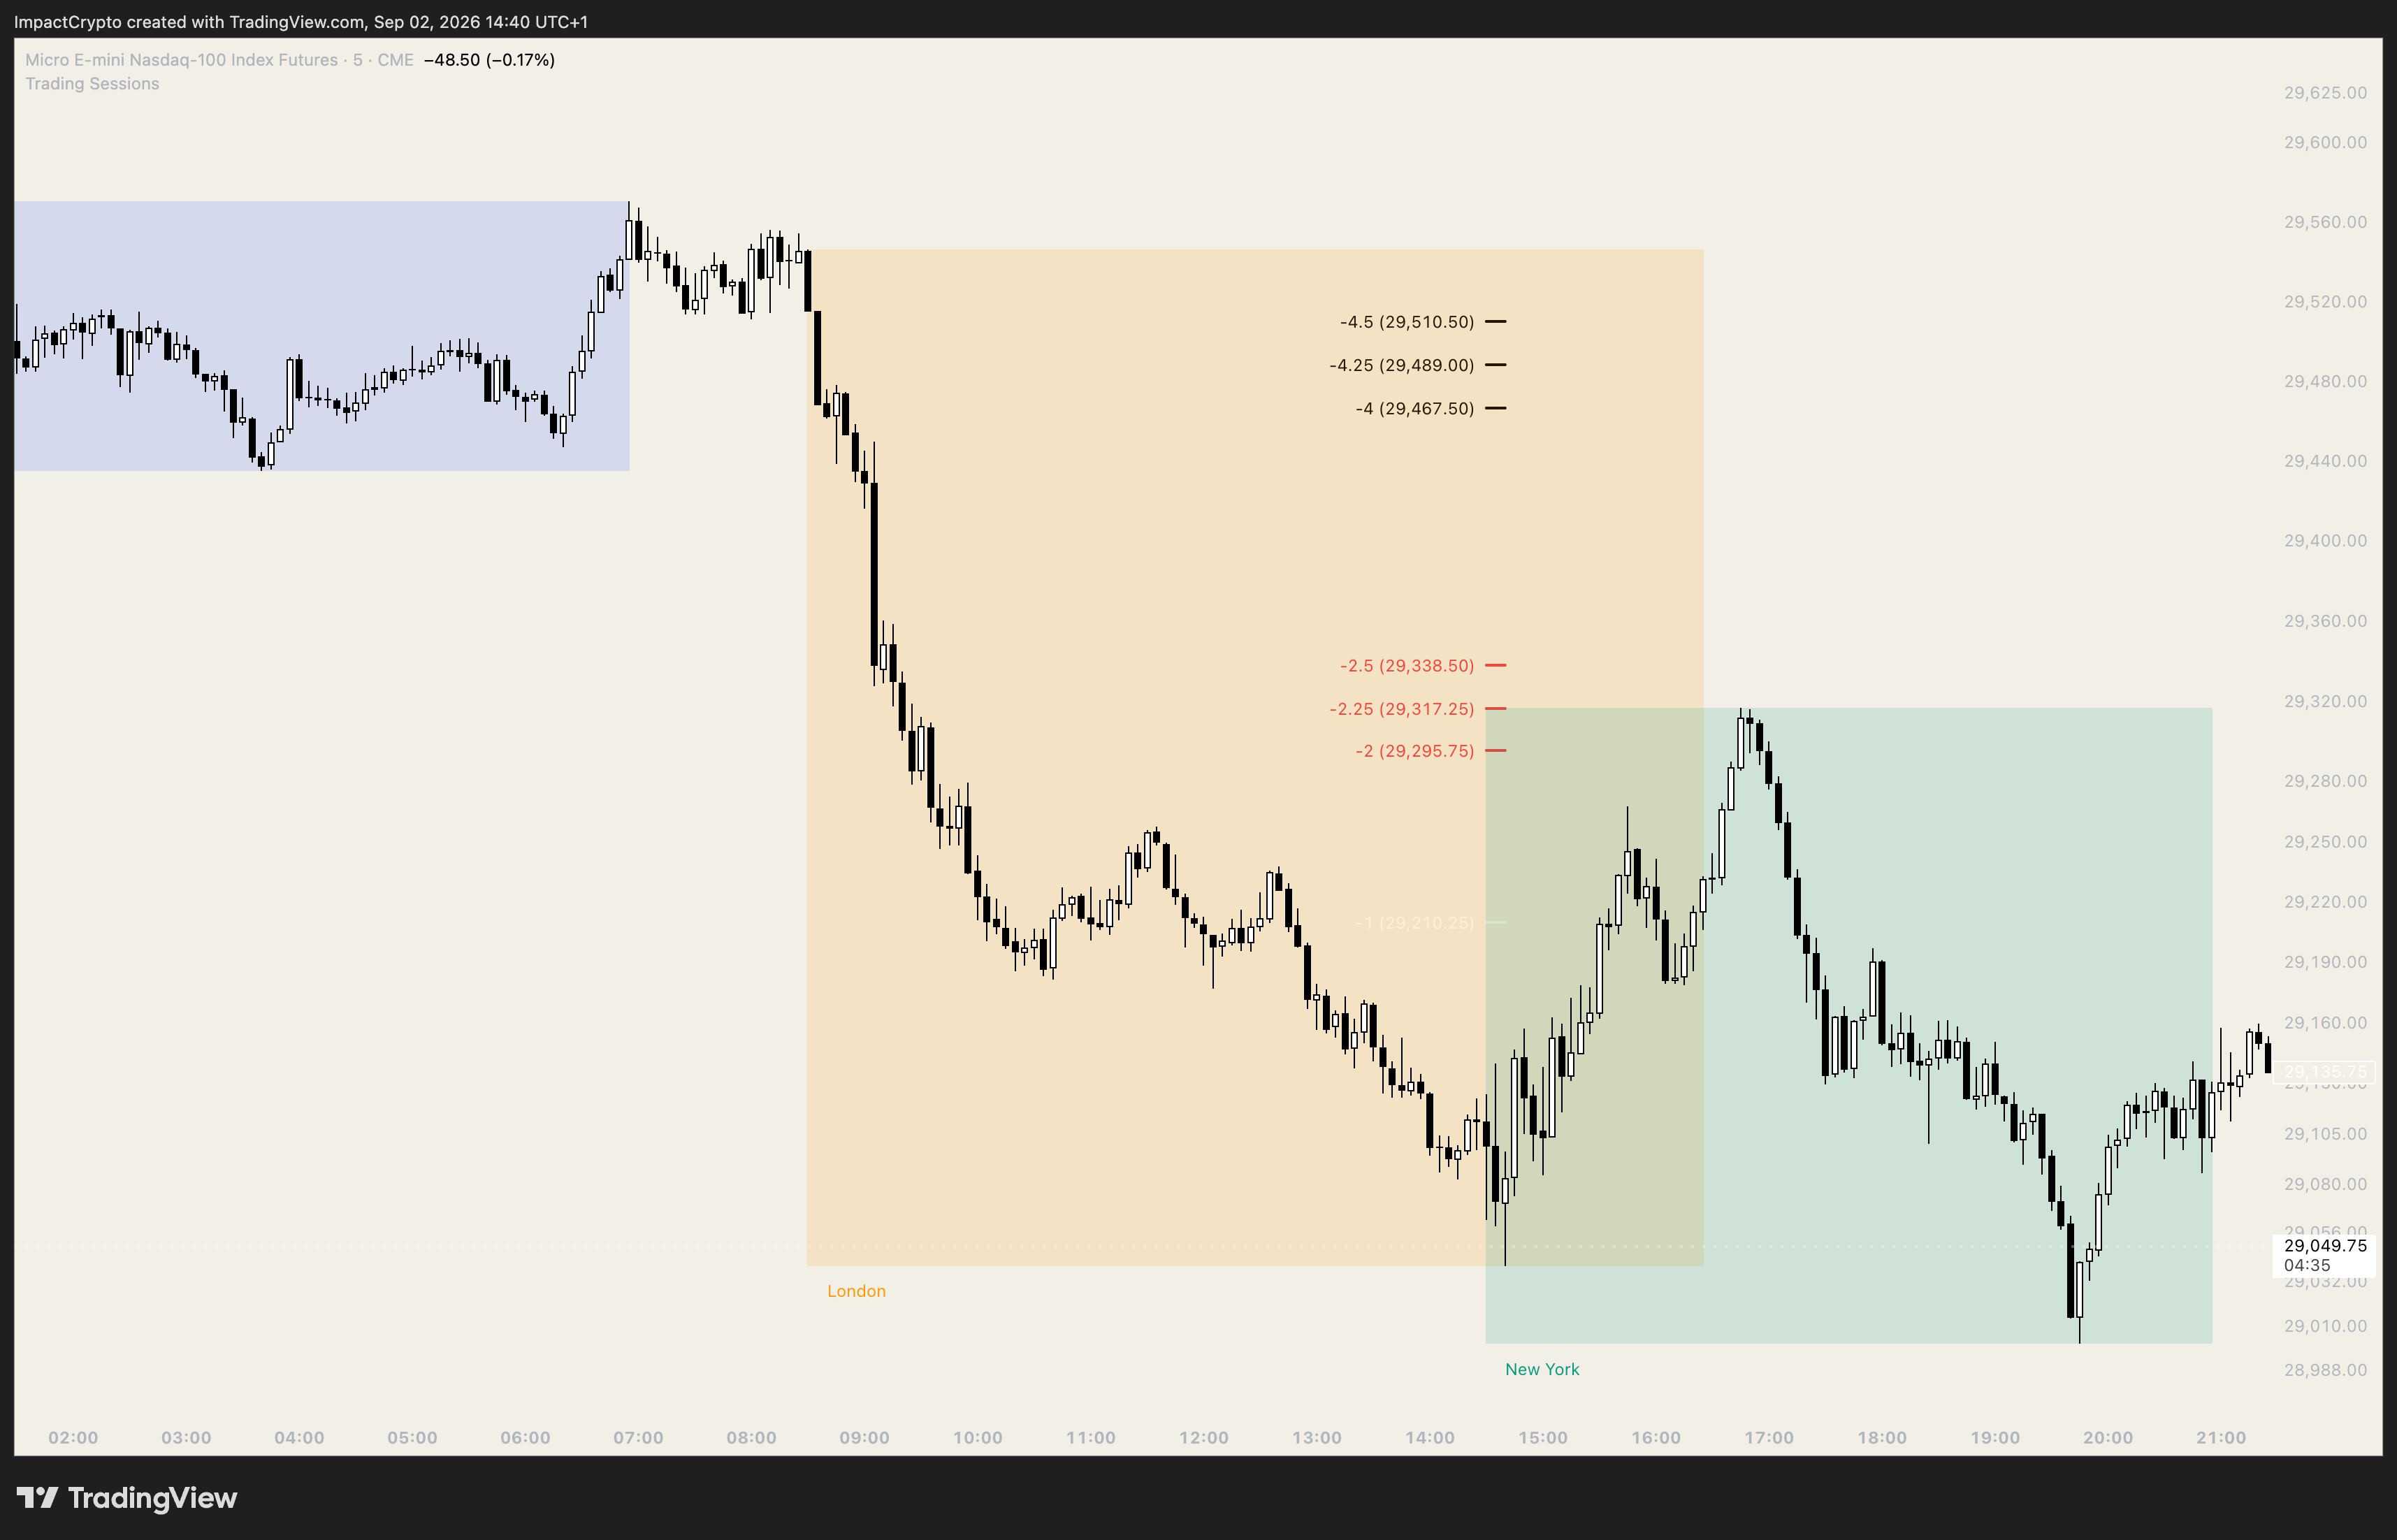
Step 2: The Anchor Leg (Mapping the Sweep)
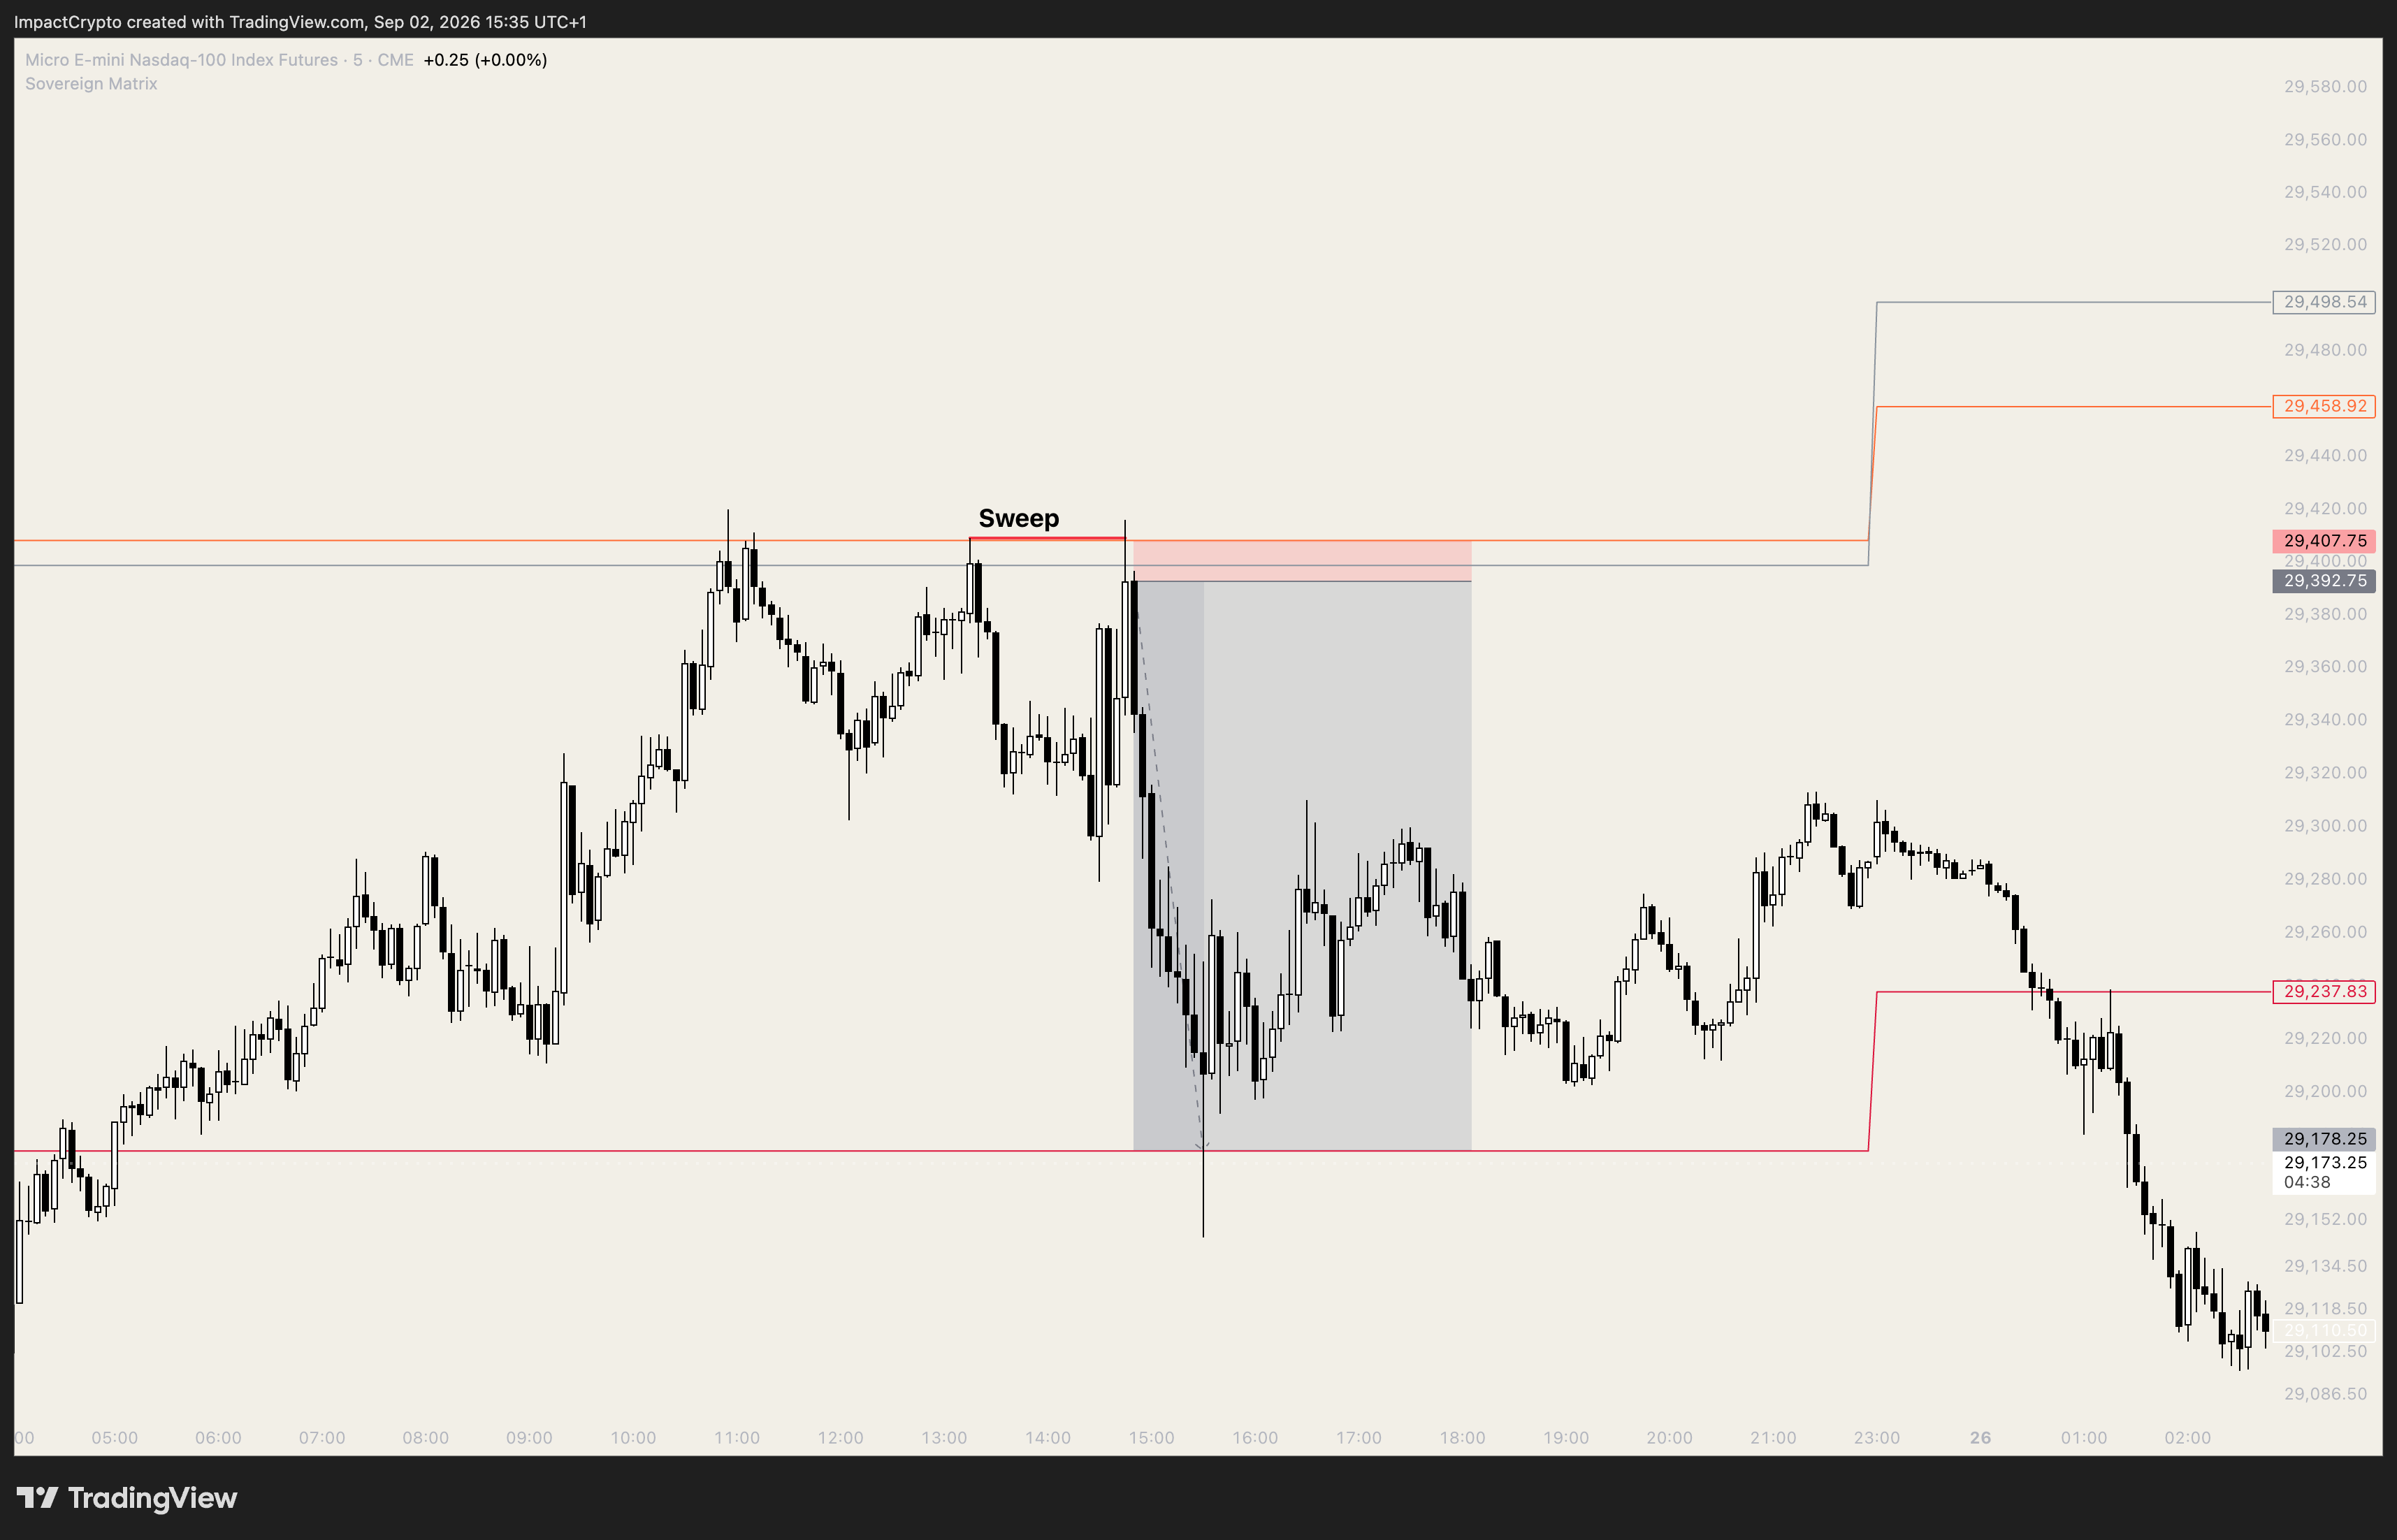
Look for the 8:00 AM – 1:00 PM UK liquidity grab. We anchor our standard deviation projections from the absolute rejection point of that specific sweep to map NY Open trajectory.

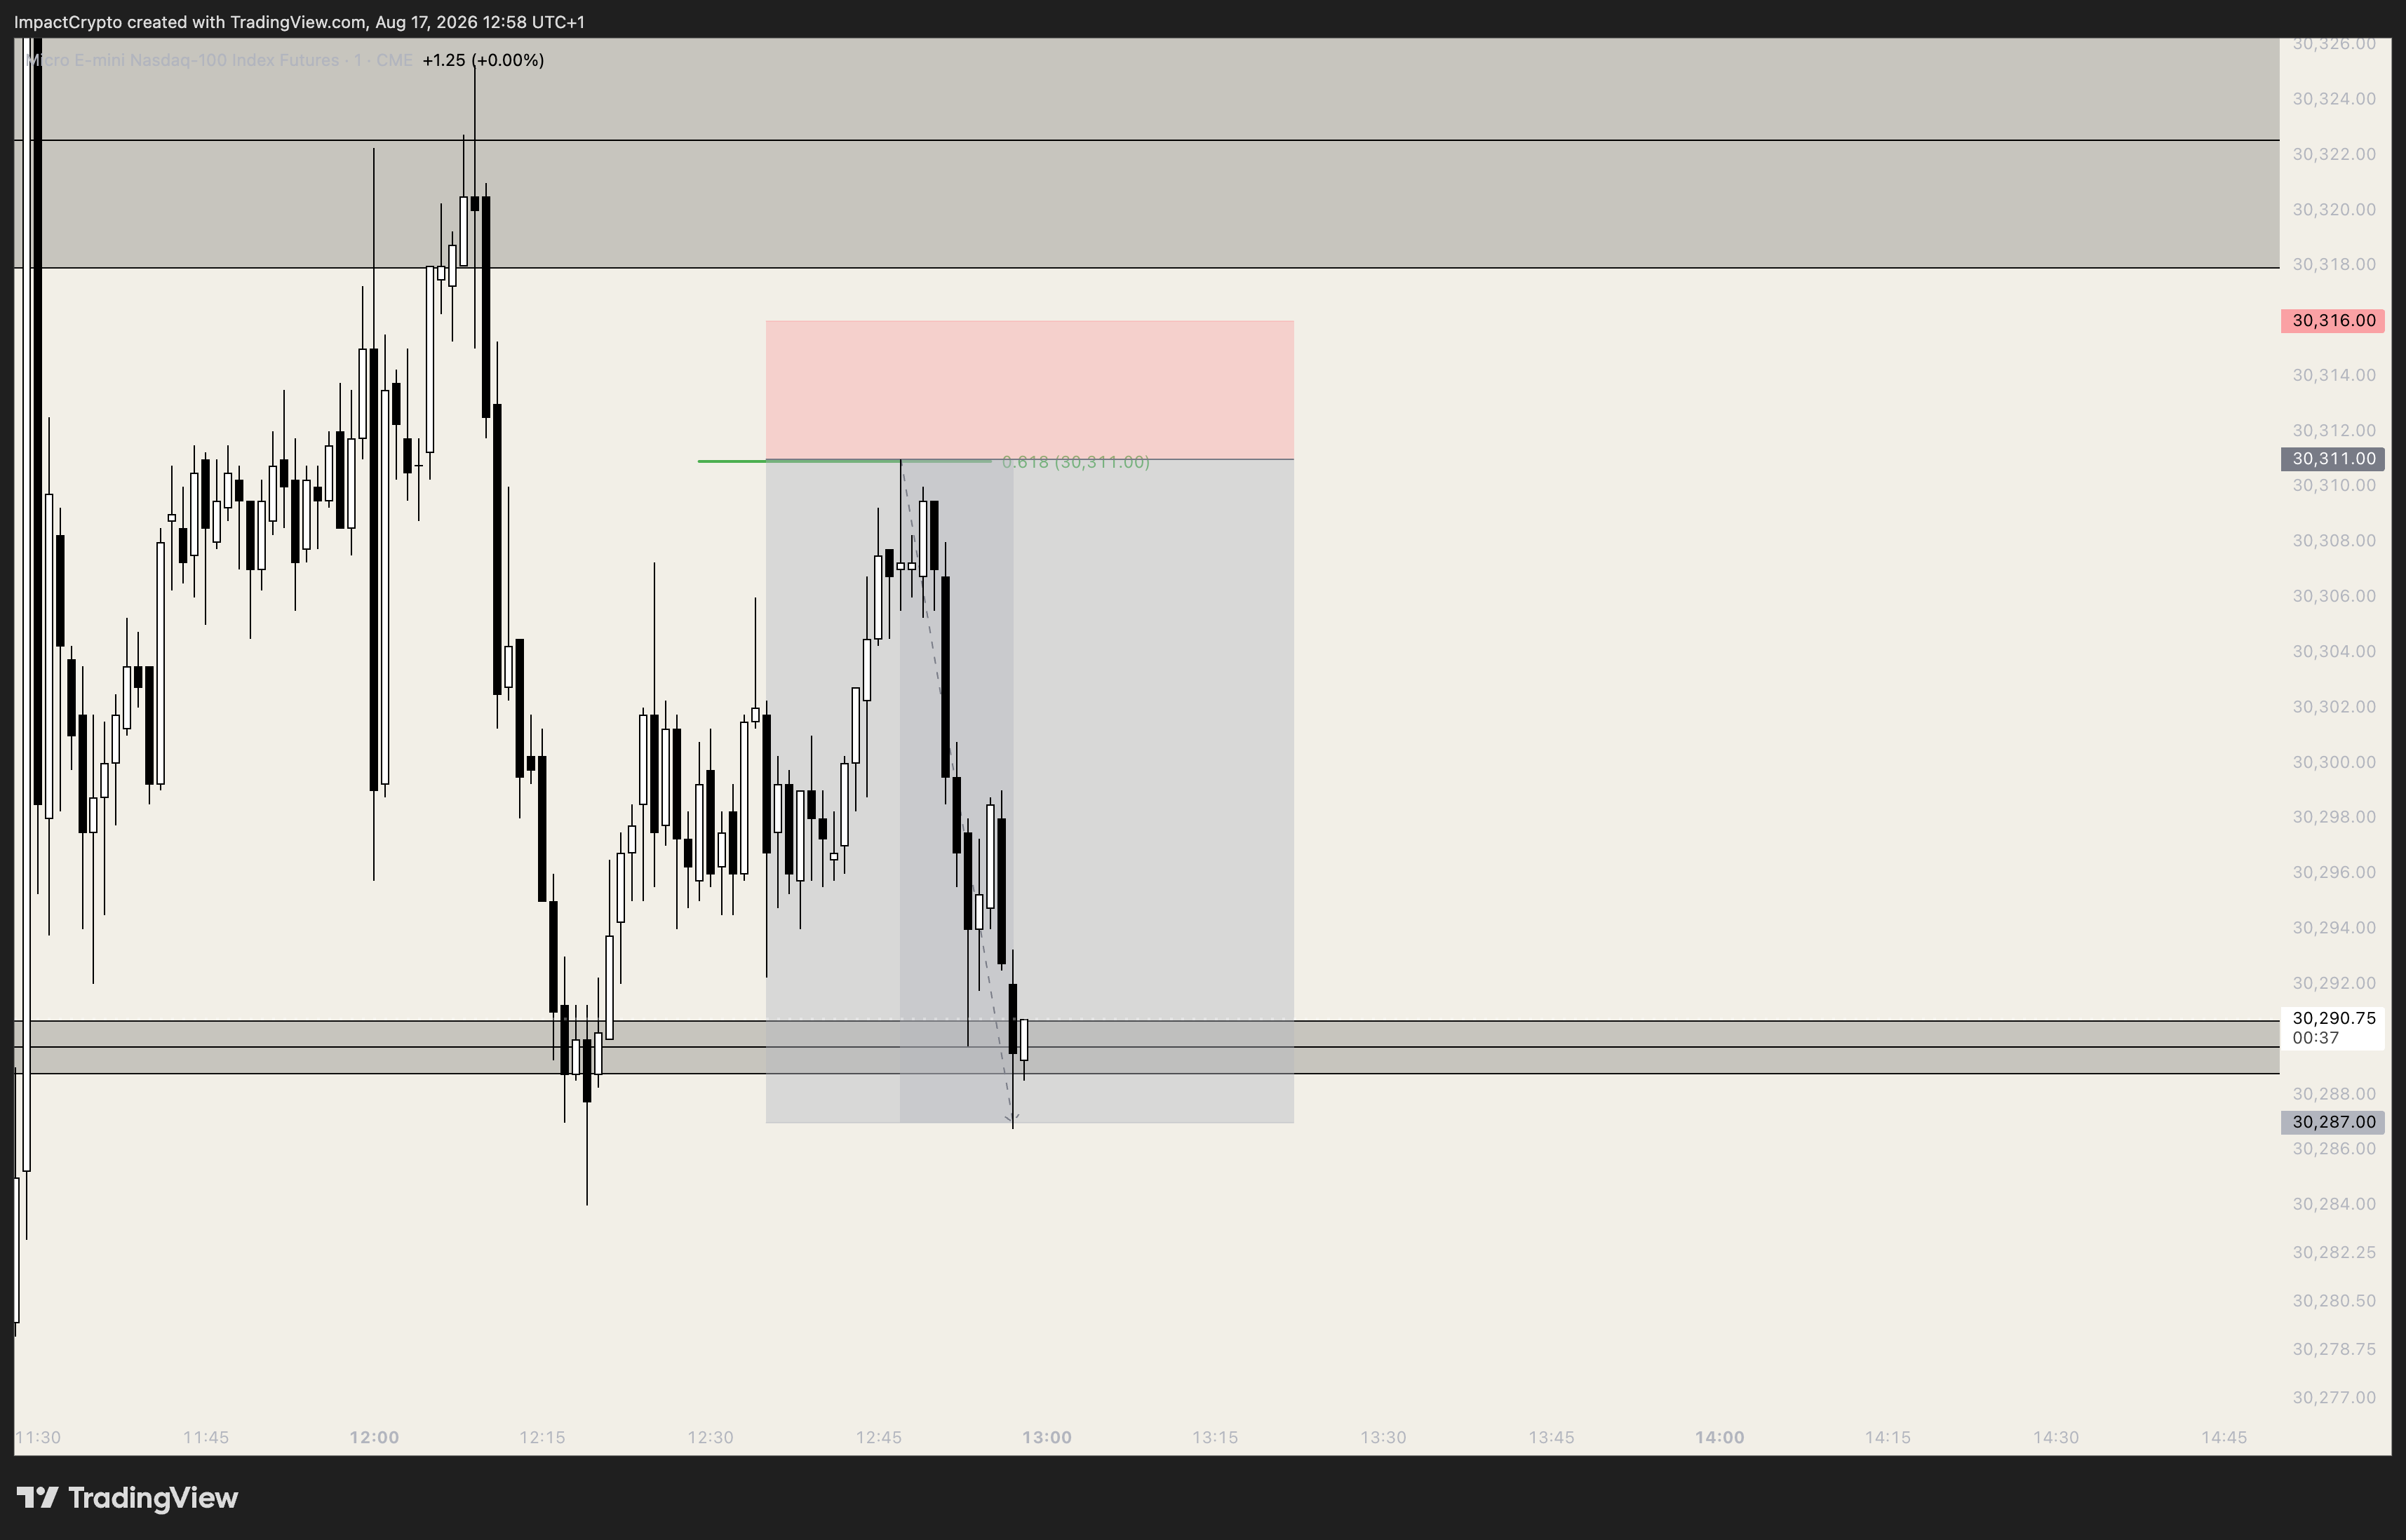
ANCHOR LEG // LONDON LIQUIDITY SWEEP
SWEEP MAP
Anchor Leg Sweep
THE ANCHOR LEG: Mapping London/Pre-NY liquidity sweeps to project geometric Standard Deviation targets into NY.
CHAPTER 04 // OPERATIONAL WORKFLOW PART 4.2

Market Mode Alpha: Balanced

By analyzing price location relative to Boundary Vectors before the NY Open, we classify the market mode:

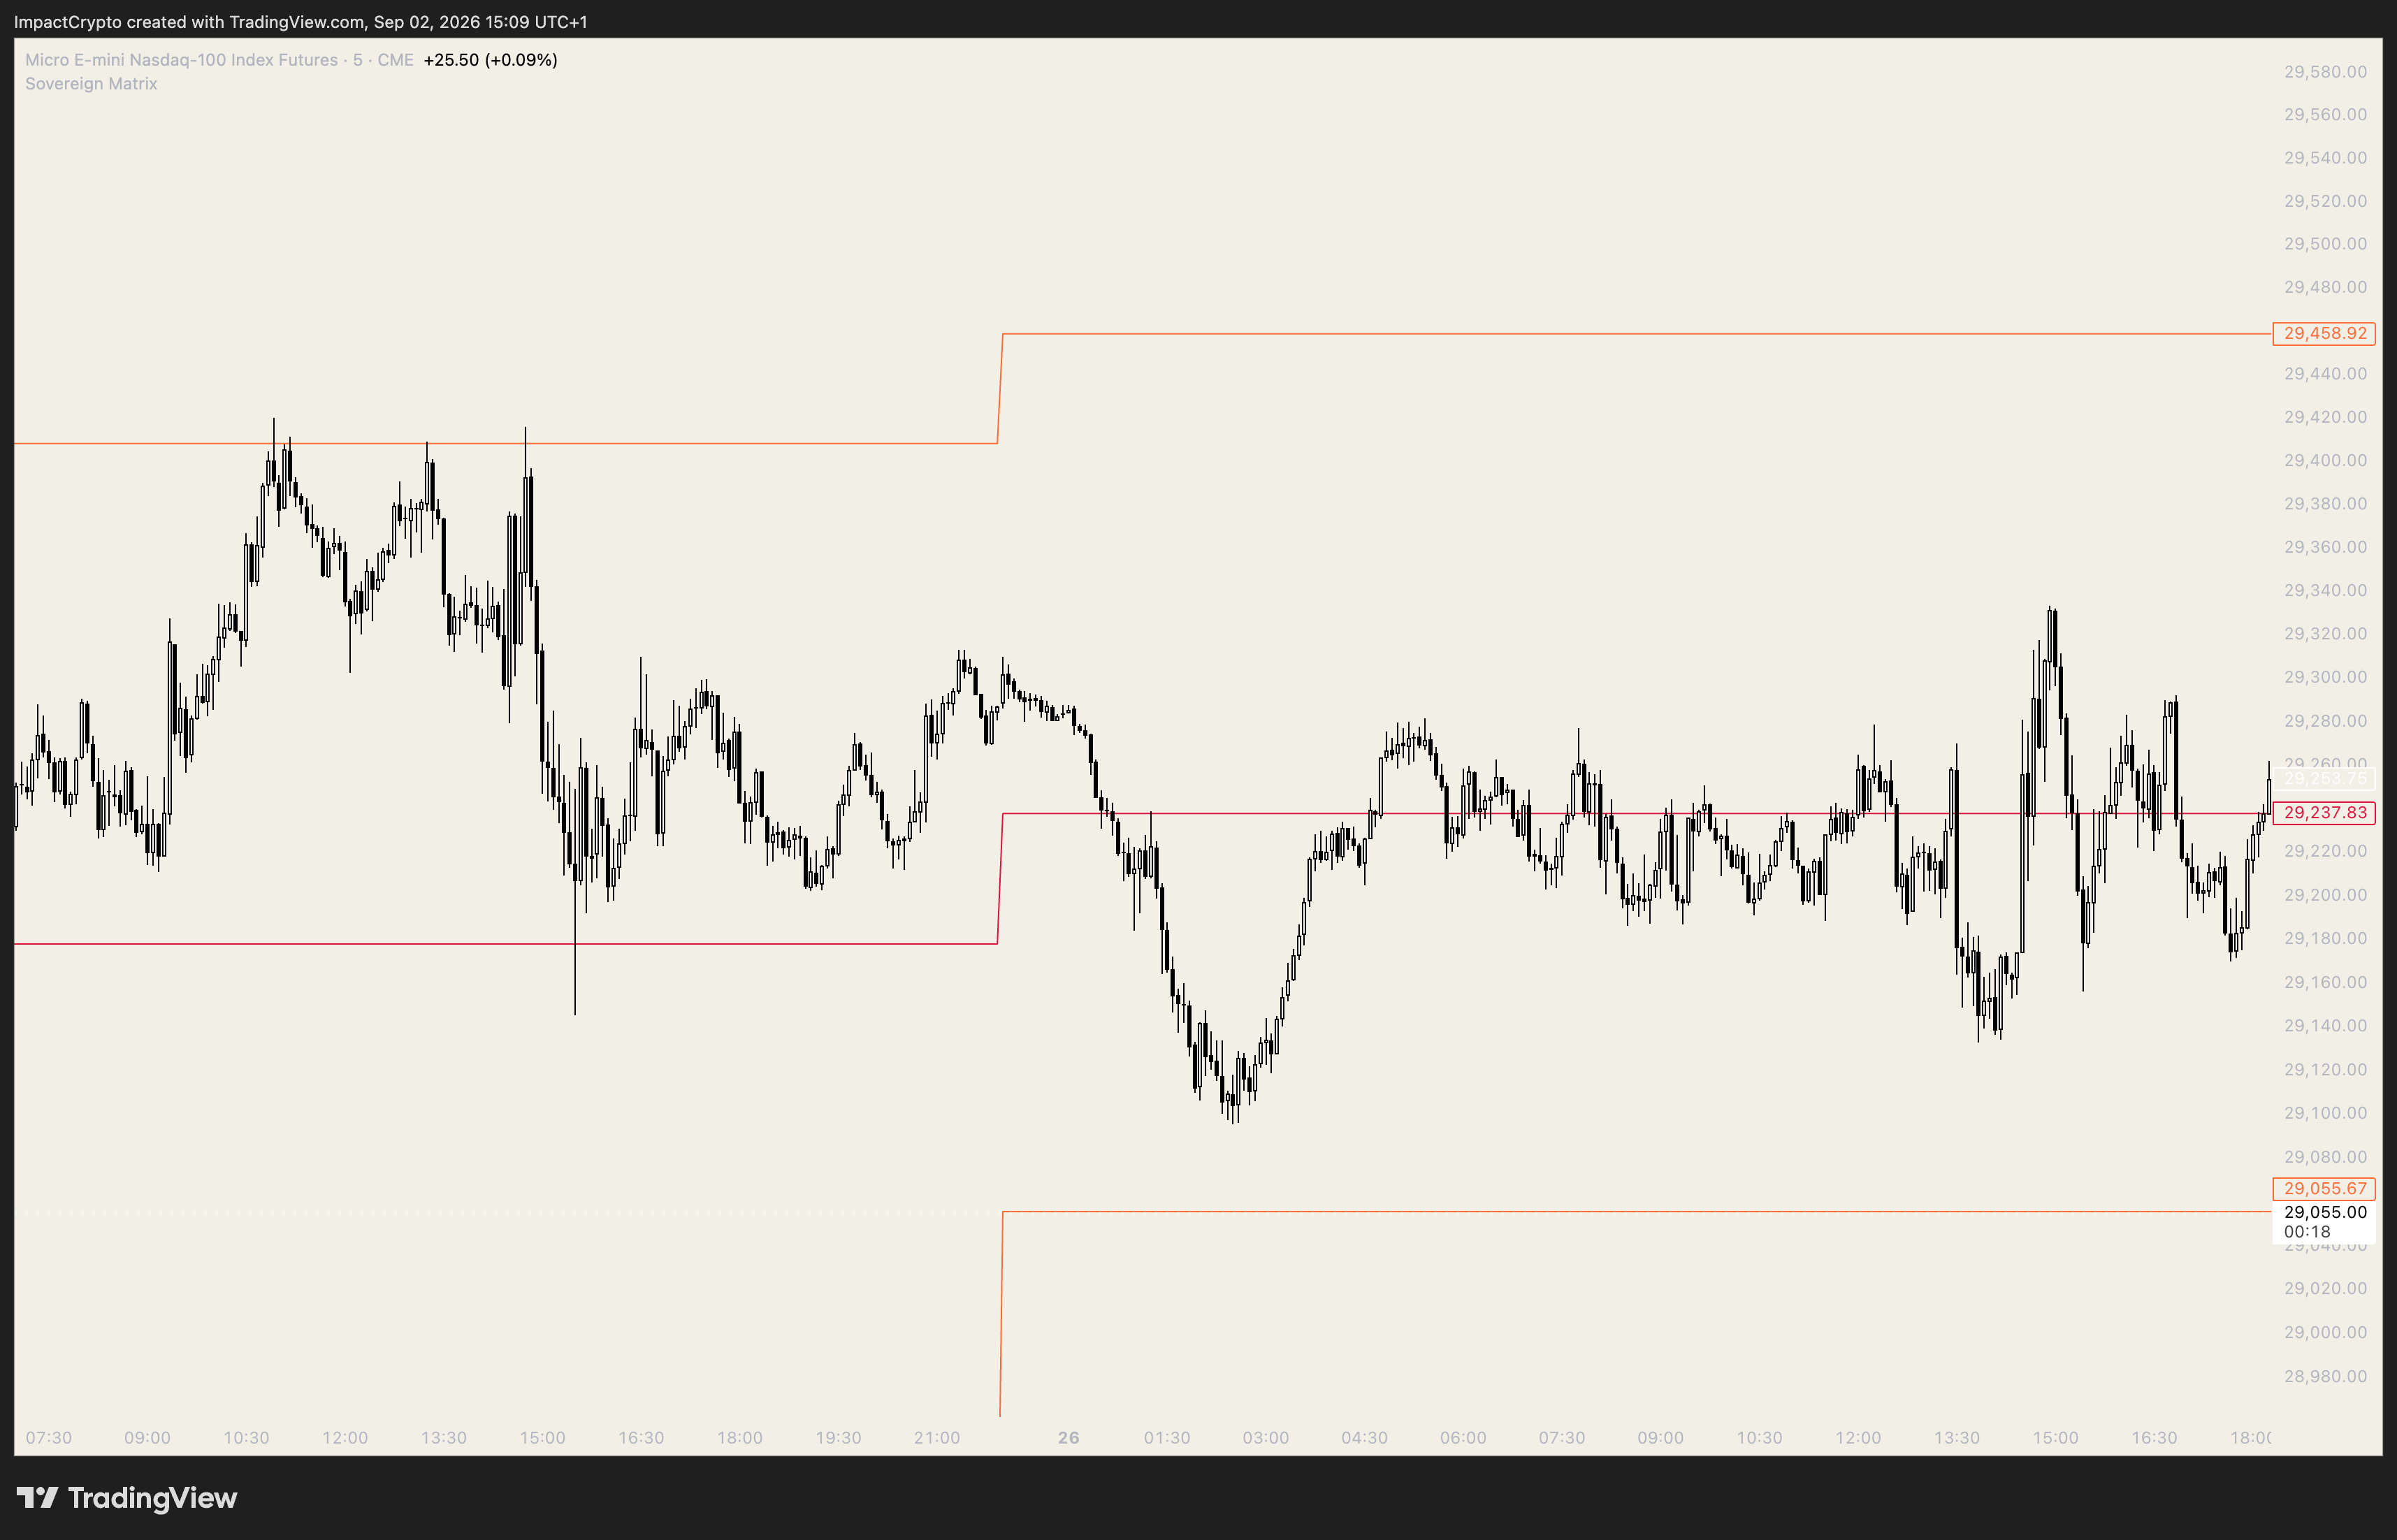
  • The Visual: Price trades quietly inside the primary BV-S1 and BV-R1 boundaries.
  • The Logic: The market is content with current range value, actively rotating around the Central Equilibrium (CE).
  • The Execution: Mean-reversion plays off BV-S1 (Long) and BV-R1 (Short) hold high statistical probability.
  • Volatility Reality: On NQ, a balanced rotation between primary boundaries frequently yields 200 to 300+ points of clean movement.
MARKET MODE ALPHA // BALANCED ROTATION
MODE ALPHA
Balanced Market Mode
MARKET MODE ALPHA (BALANCED): Session rotation constrained strictly between BV-S1 and BV-R1 around CE.
CHAPTER 04 // OPERATIONAL WORKFLOW PART 4.3

Market Mode Beta: Expansion

When overnight order flow stretches past standard volatility thresholds before the NY Open:

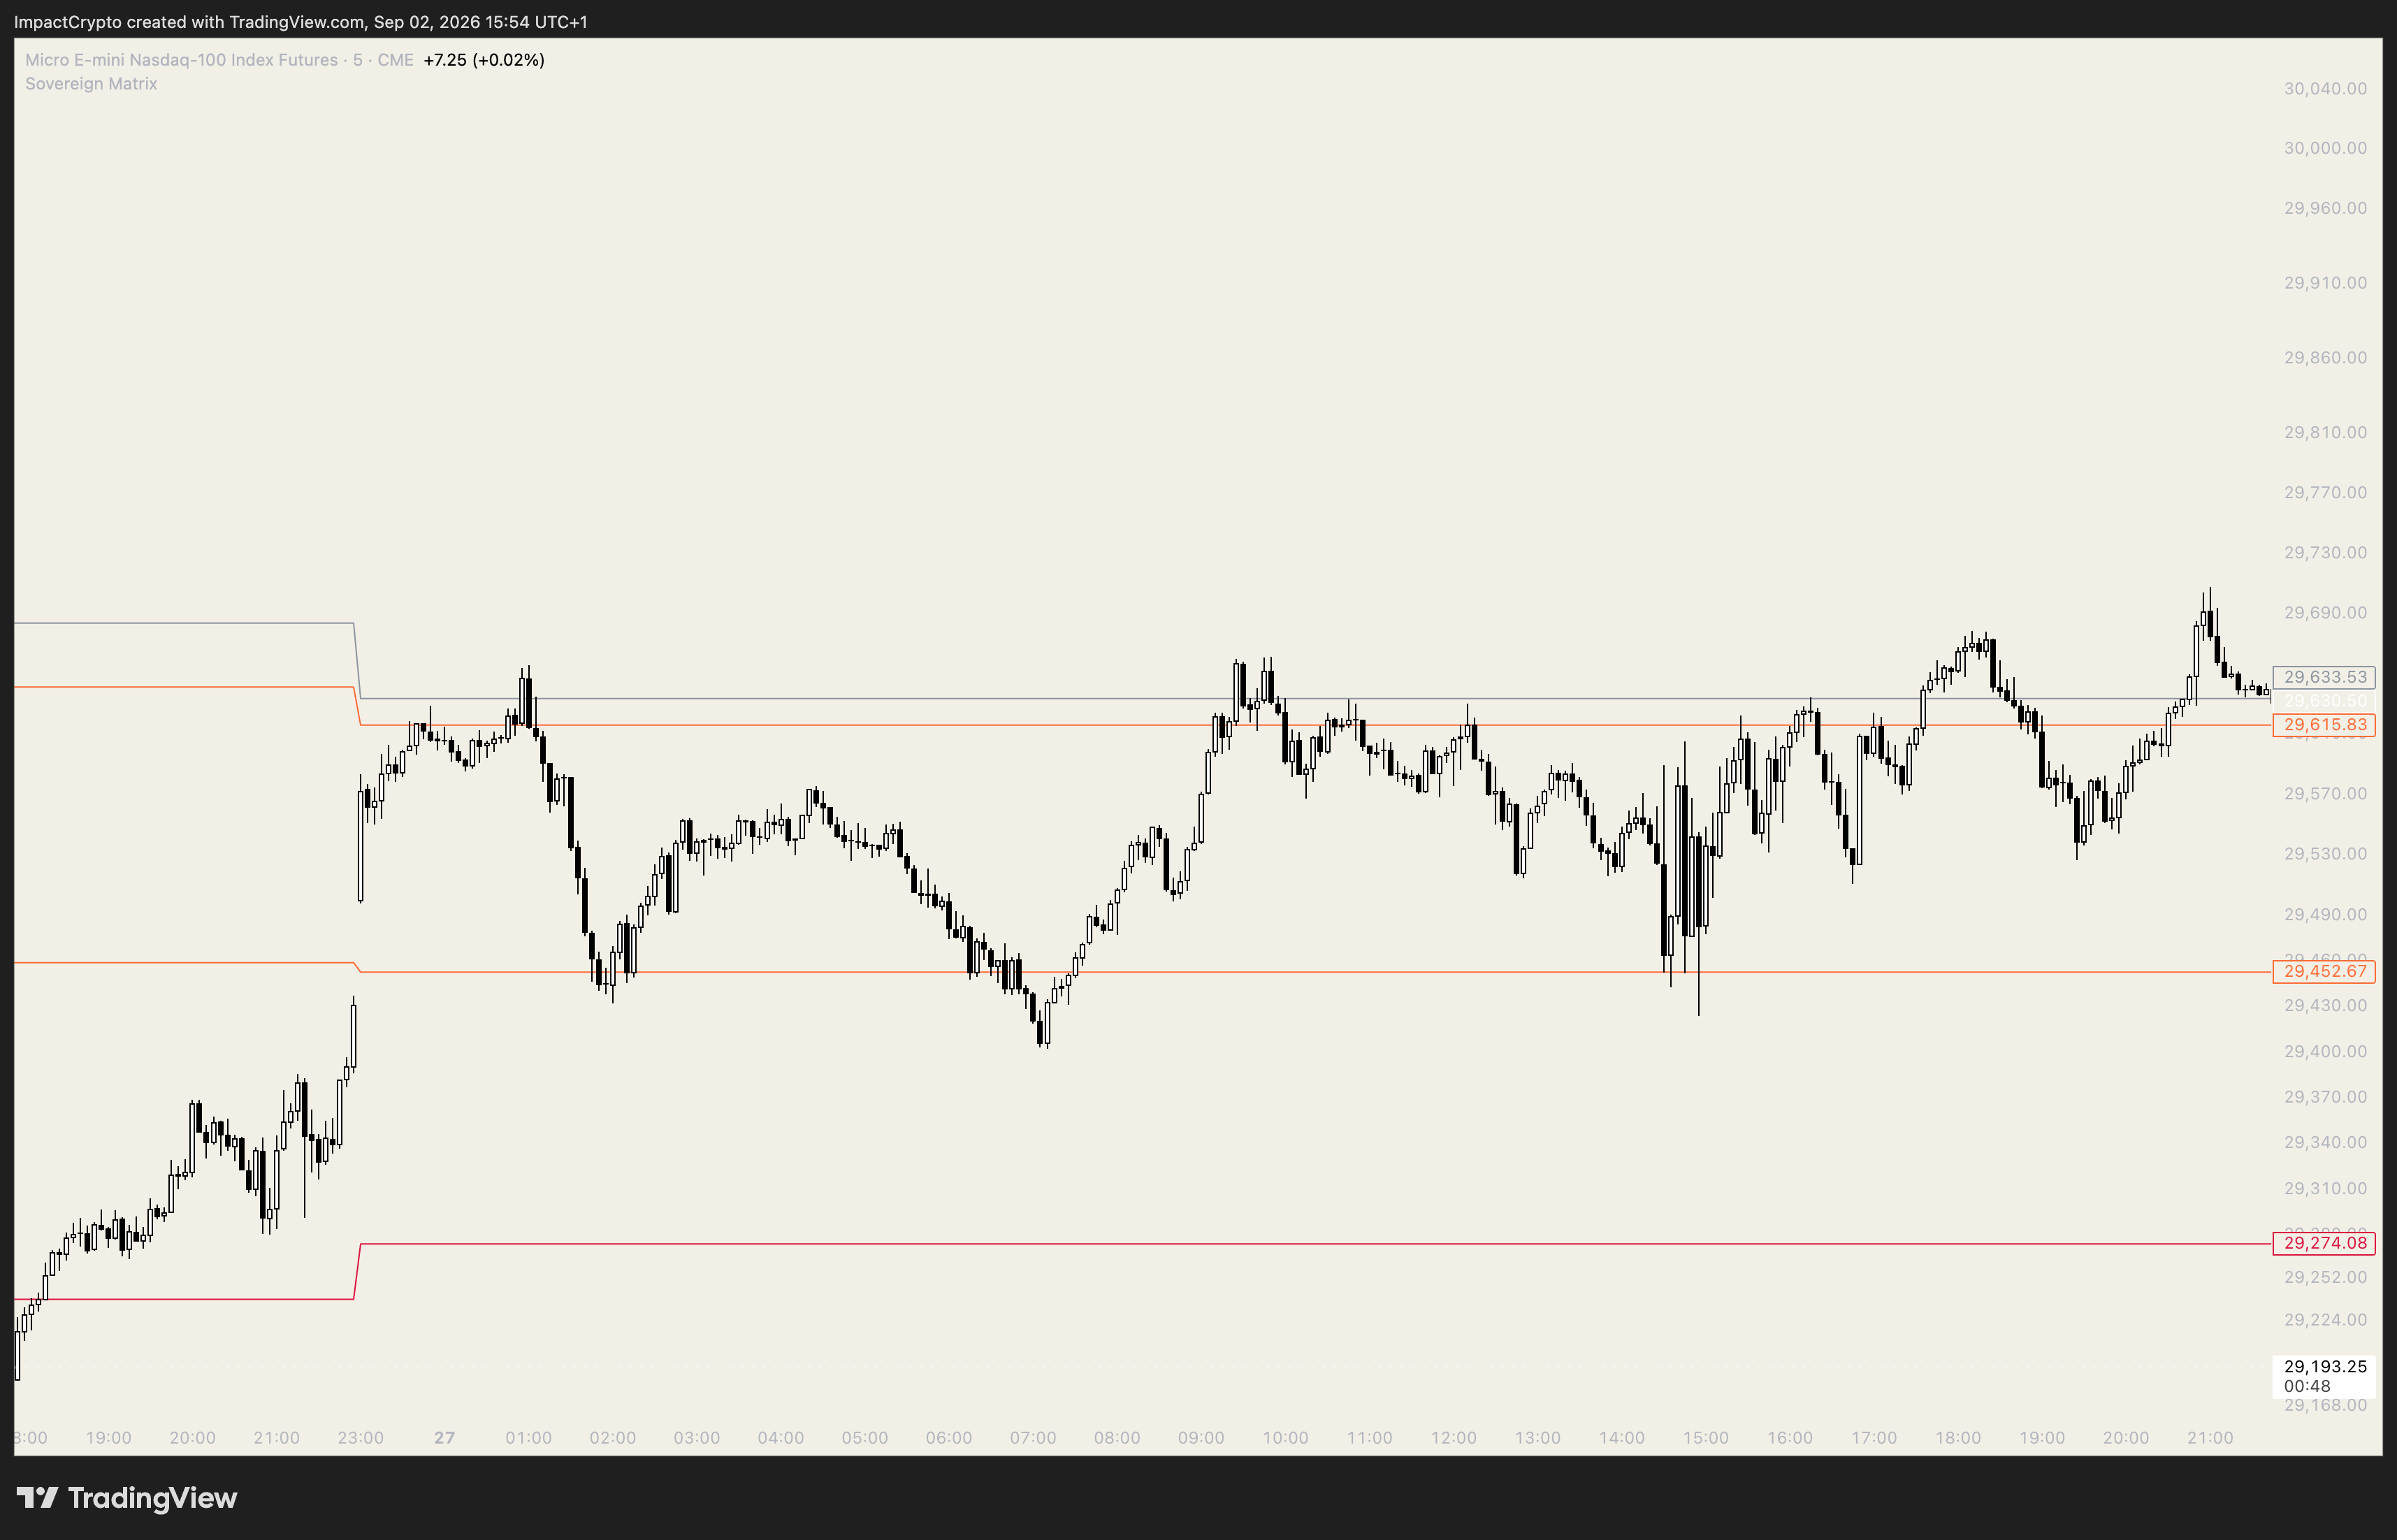
  • The Visual: Price trades at or completely outside primary BV-S1 / BV-R1 boundaries prior to New York cash open.
  • The Logic: The overnight spring is stretched. Market makers are repricing into a completely new value area.
  • The Execution: Boundaries act as momentum springboards rather than absorption walls. Standard reversions will fail. Targets immediately shift to outer Fatigue and Capitulation Vectors (CV-S4/S5 or CV-R4/R5).
MARKET MODE BETA // RANGE EXTENSION
MODE BETA
Expansion Market Mode
MARKET MODE BETA (EXPANSION): Pre-market boundary penetration targeting outer Clearance Vectors.
THE IMPACT THEORY PHASE V

CHAPTER 5:
TACTICAL SETUP PROFILES

CONFLUENCE, EXECUTION & TARGET MANAGEMENT
CHAPTER 05 // SETUP PROFILES PART 5.1

The Boundary Rejection (The Sniper)

Our primary mean-reversion profile, executed off extreme boundary exhaustion:

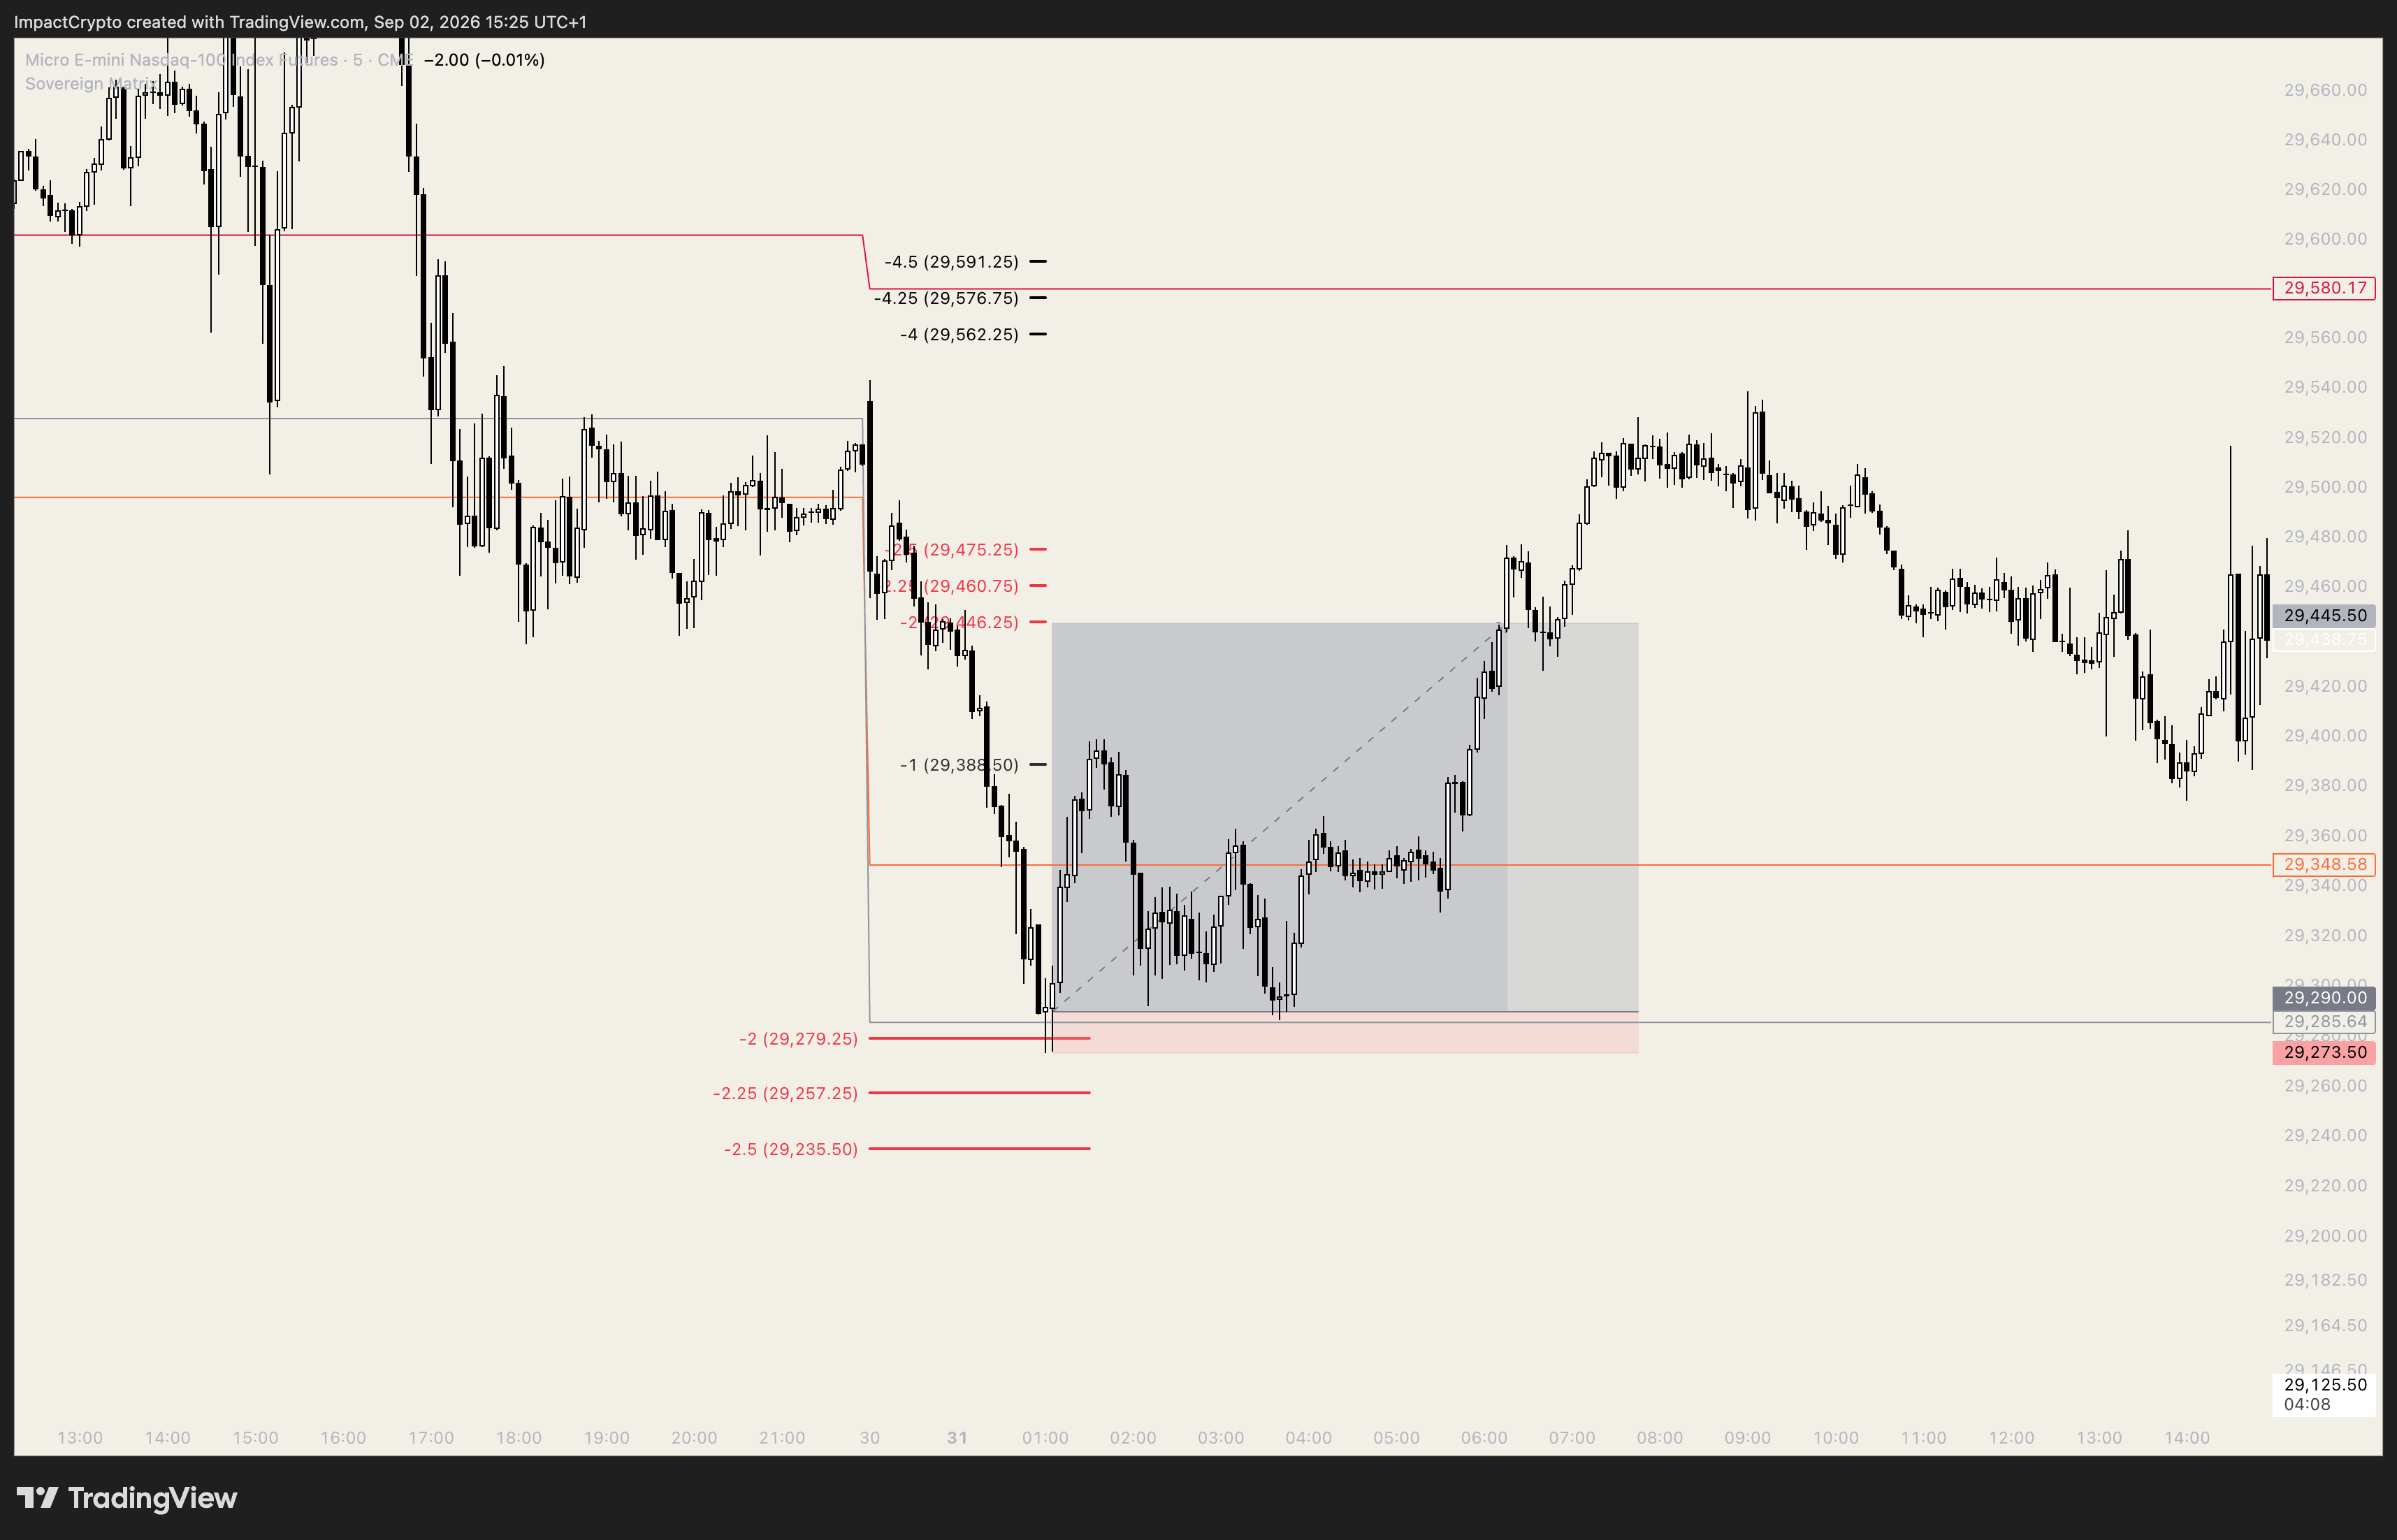
  • Step 1: Liquidity Flush: Price aggressively expands into the outer standard deviation boundary cluster (+2.0, +2.25, and +2.5 SD for distribution shorts; -2.0, -2.25, and -2.5 SD for accumulation longs), overlapping with primary BV Resistance or BV Support.
  • Step 2: Boundary Absorption (The Rejection Block): Price pierces the +/-2.0 to +/-2.5 SD confluence zone and prints an immediate structural wick rejection on the 5-minute candle, confirming resting liquidity has halted expansion.
  • Step 3: Execution & Stop: Enter on candle reclaim close. Placing your stop loss at the bottom / tip of the 5-minute Rejection Block is valid and protected. However, NEVER place your stop loss directly on an Institutional Vector line, as algorithms routinely execute stop runs across raw boundary coordinates.
PROFILE ALPHA // SNIPER SEQUENCE
PROFILE ALPHA
Profile Alpha Setup
PROFILE ALPHA // THE SNIPER: +/-2.0 TO +/-2.5 SD CONFLUENCE SWEEP, BANKING 80% AT STRUCTURAL ROTATION AND TRAILING TO CE.
CHAPTER 05 // SETUP PROFILES PART 5.2

Target Realization & Invalidation

TARGET REALIZATION: When entry occurs deep in extended volatility where Central Equilibrium (CE) is too distant for an immediate single-leg rotation, deploy local Standard Deviation extension levels for target mapping.

Close 70% to 80% of position size at the primary structural rotation node (+/-2.0 SD or nearest BV Support/Resistance level), move stops to breakeven, and allow remaining runner contracts to trail toward Central Equilibrium (CE) or extended macro vectors.

🔴 INVALIDATION RULE

If a 5-minute candle closes completely through the vector boundary with zero wick rejection, the setup is immediately aborted. Never attempt to catch falling knives.

PROTOCOL RULES SNIPER EXECUTION ROADMAP
Confluence Zone: +/-2.0, +/-2.25, +/-2.5 SD + BV Level
Trigger Candle: 5m Rejection Block (Wick Reclaim)
Risk Parameter: Bottom of RB / 5–7 Pts Past Vector
Scale-Out (TP1): 70–80% at Primary Rotation Node
Runner (TP2): Central Equilibrium (CE) / Opposite BV
CHAPTER 05 // SETUP PROFILES PART 5.3

The Momentum Breakout & Retest

Applied symmetrically across both Long and Short market expansions:

  • Long Momentum: High-volume candle penetration closing firmly above BV Resistance (BV-R), followed by a low-volume retest holding the level as support, targeting outer Clearance Vectors (CV-R4/CV-R5).
  • Short Momentum: High-volume candle penetration closing firmly below BV Support (BV-S), followed by a corrective retest rejecting off the level as resistance, targeting lower capitulation bands (CV-S4/CV-S5).
  • Execution: Enter on confirmed rejection wick during level retest. Invalidate immediately if price closes back inside original range.
PROFILE BETA // MOMENTUM RETEST
PROFILE BETA
Profile Beta Setup
PROFILE BETA // MOMENTUM SHIFT: BOUNDARY BREAKOUT AND RETEST PROTOCOL TARGETING OUTER VOLATILITY NODES.
CHAPTER 05 // SETUP PROFILES PART 5.4

The "M" / "W" Re-Sweep

The ultimate structural liquidity trap clearing weak hands before macro redirection:

  • Profile Gamma Long (The 'W' Re-Sweep): Price drives into extreme capitulation node (CV-S5 / -4.5 SD), posts initial bounce, sweeps 10–15 points below initial low to clear stops, aggressively reclaims level, and completes a structural 'W' base before generational upward expansion.
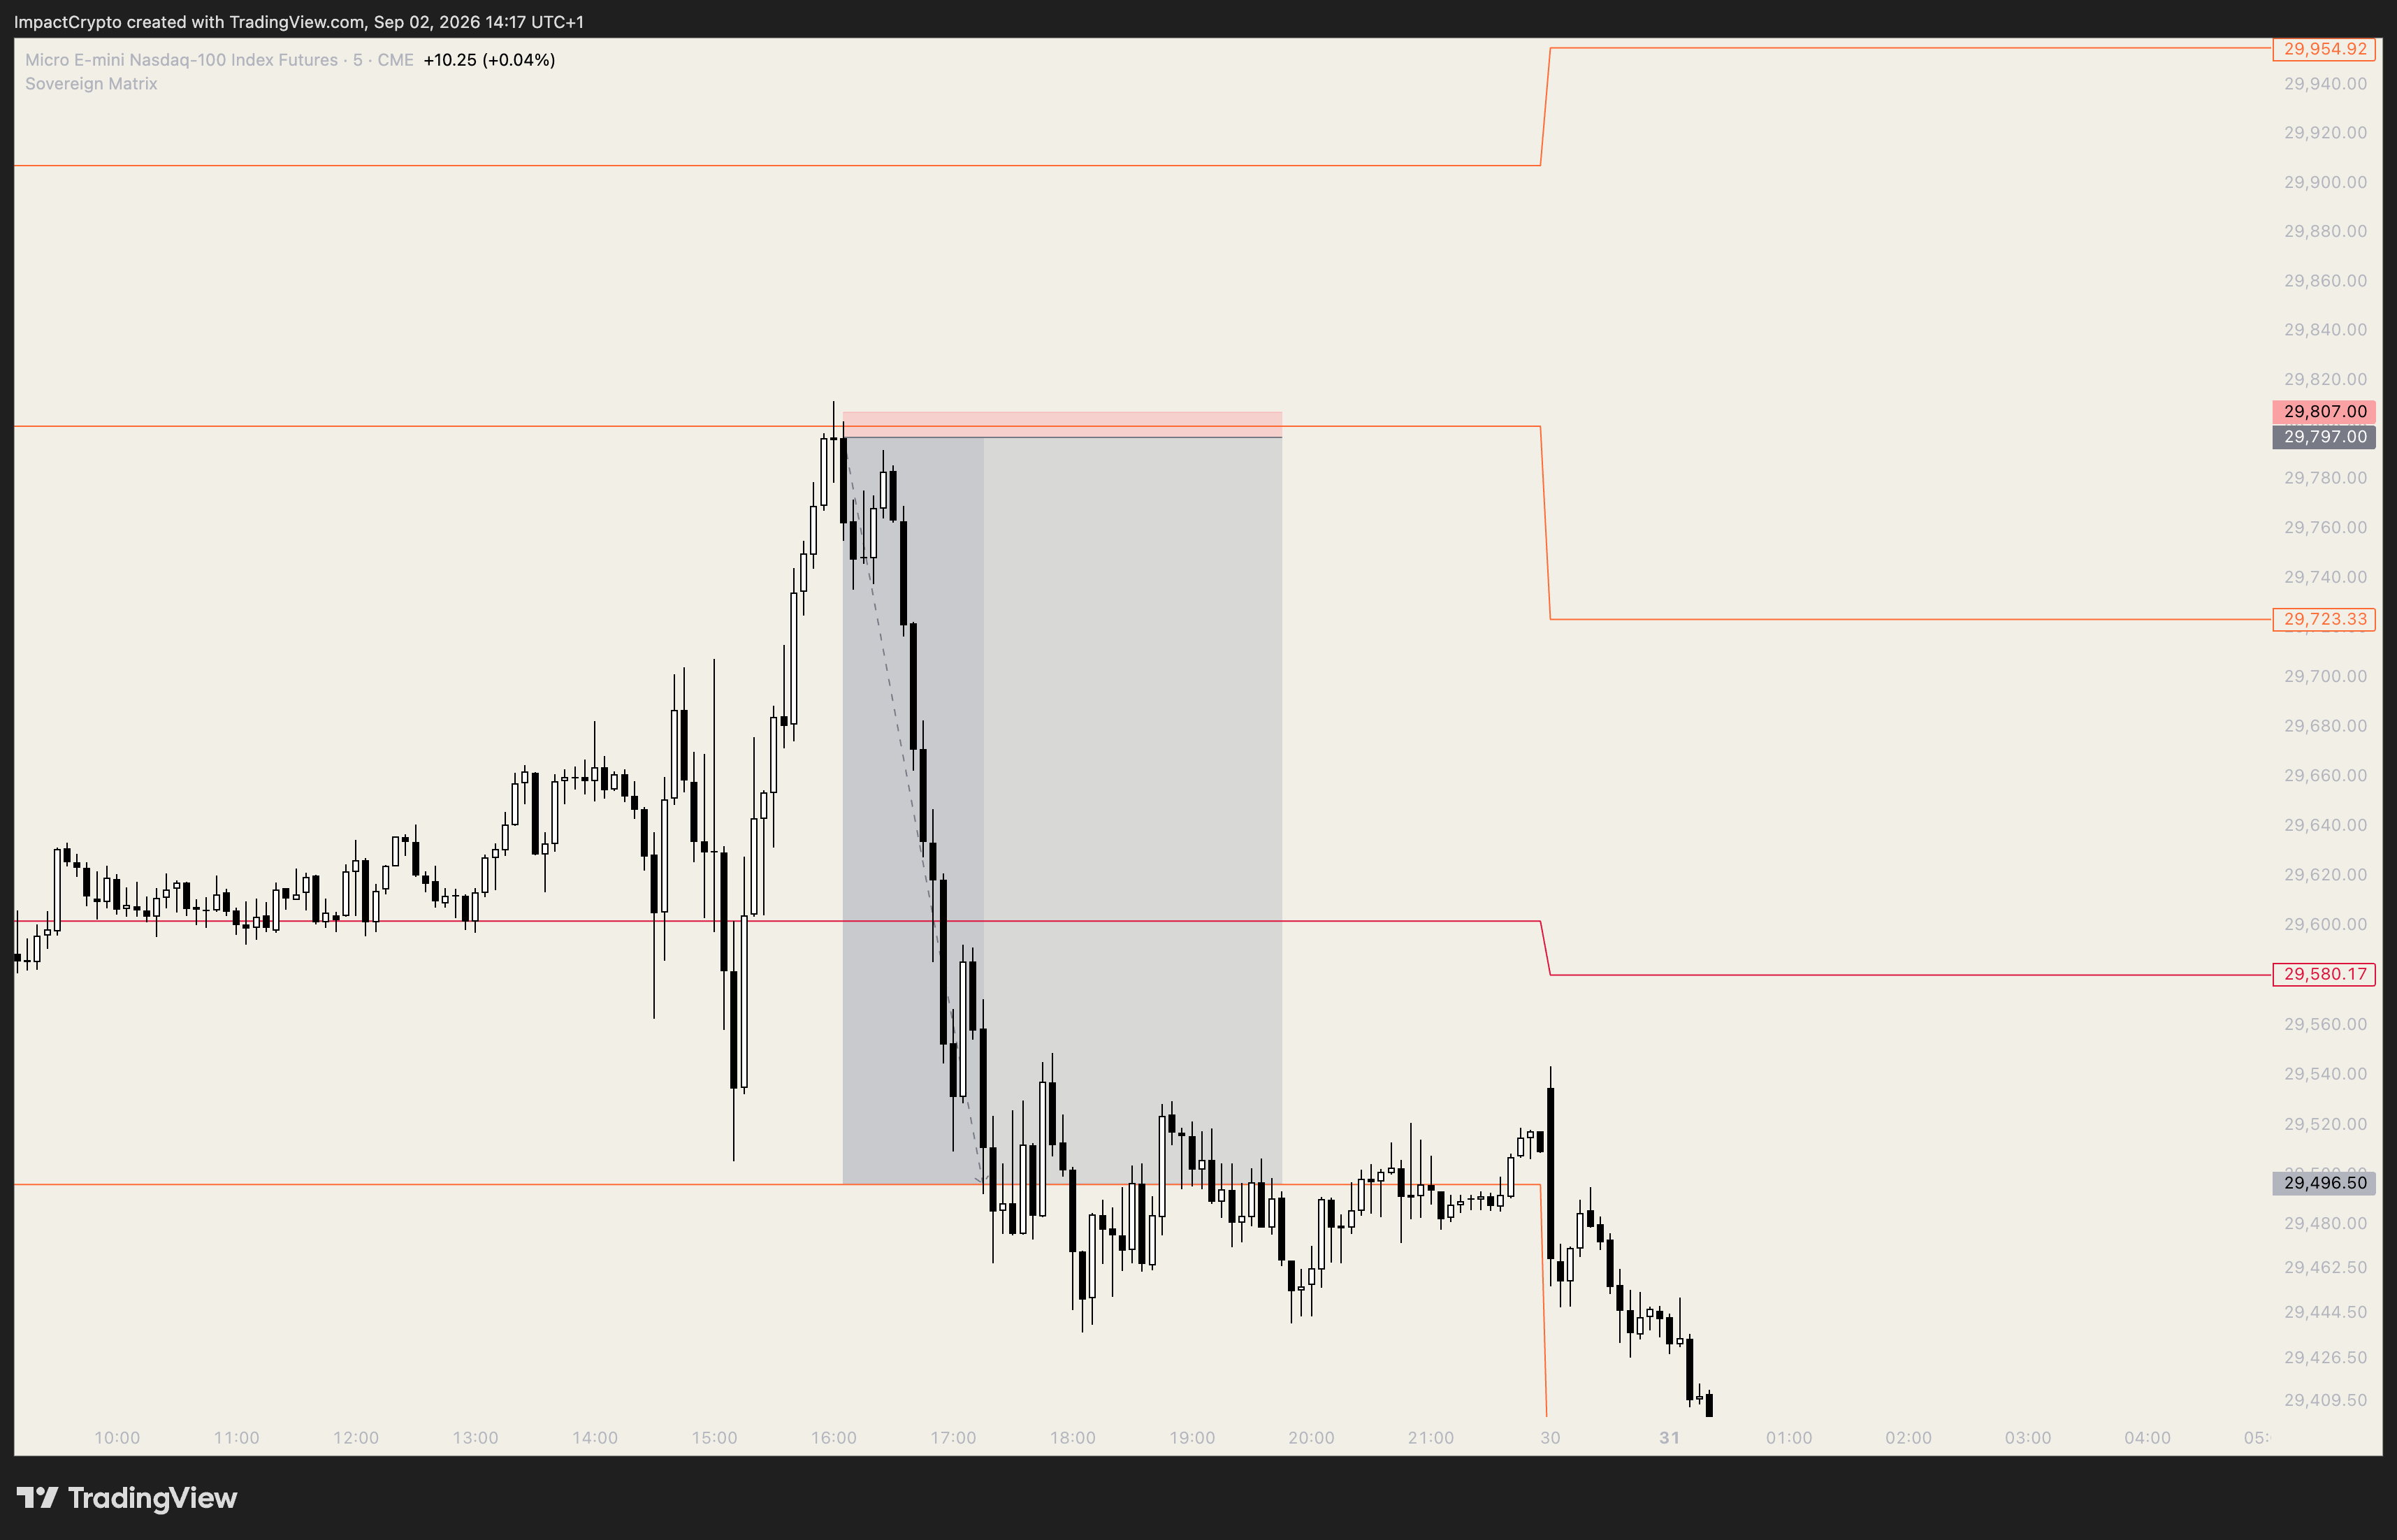
  • Profile Gamma Short (The 'M' Re-Sweep): Price expands aggressively into extreme BV Resistance or CV-R5 (+4.5 SD), forms initial peak, pushes higher on secondary leg to purge buy-side liquidity above first high, aggressively rejects with zero candle body acceptance above resistance, and completes a structural 'M' top before flushing into CE.
PROFILE GAMMA // GENERATIONAL REVERSAL
PROFILE GAMMA
Profile Gamma Setup
PROFILE GAMMA // THE 'M' / 'W' RE-SWEEP: SECONDARY LIQUIDITY PURGE CLEARING EARLY PARTICIPANTS BEFORE INSTITUTIONAL EXPANSION.
THE IMPACT THEORY PHASE VI

CHAPTER 6:
INSTITUTIONAL RISK PROTOCOL

THE 5–7 POINT BUFFER & ASYMMETRIC R:R
CHAPTER 06 // RISK PROTOCOL PART 6.1

The Boundary Buffer Rule

Institutional algorithms are programmed to hunt retail stop-losses placed directly on obvious level lines. Market makers frequently execute a Stop Run—pushing price 3 to 5 points past boundaries to clear early participants before true reversal starts.

  • The Strict Rule: Placing your stop-loss at the bottom of the 5-minute Rejection Block is completely fine and valid. However, you must NEVER place your stop-loss directly on an Institutional Vector Level line, as algorithms routinely sweep vector boundaries.
  • The Shield: When entering near raw levels, position stops 5–7 points beyond the vector line or tuck your stop safely below the Rejection Block low behind resting institutional liquidity.
STOP-LOSS PLACEMENT ARCHITECTURE PROTOCOL SPEC
[ INSTITUTIONAL BOUNDARY VECTOR ] INVALID STOP ZONE ❌

Never place stops directly on the vector line. Market maker algorithms target exact level coordinates for pre-reversal liquidity sweeps.

[ 3–5 POINT ALGORITHMIC STOP RUN ] LIQUIDITY HUNT ZONE

Algorithms purposely spike 3 to 5 points past the vector boundary to harvest amateur stops before initiating true reversal.

🛡️ [ SOVEREIGN BOUNDARY BUFFER & REJECTION BLOCK FLOOR ] PROTECTED STOP ZONE ✅

Placing stops at the bottom of the Rejection Block or 5–7 points beyond the vector line insulates your position behind resting institutional liquidity.

CHAPTER 06 // RISK PROTOCOL PART 6.2

Contract Sizing & Session Rules

The Contract Sizing Equation: If the required 5–7 point Boundary Buffer requires a risk distance wider than 15–20 points, never tighten your stop. Instead, reduce position size to 1 contract. Capturing an 80-point run on 1 contract is vastly superior to being stopped out on 2 contracts on a minor pre-market sweep.

Operational Lockdown Rules:
• Two-Strikes Rule: Maximum of 2 losses per session. Upon second loss, your Edge for the day is expired. Close platform immediately.
• 15-Minute News Rule: Flat 15 min before/after CPI, NFP, FOMC.
• Friday Flat: Close all intraday positions flat by 4:00 PM UK.

GOVERNANCE OPERATIONAL DISCIPLINE MATRIX
Max Session Losses: 2 Strikes (Immediate Shutdown)
Stop Placement: Bottom of RB / 5–7 Pts Past Vector
Sizing Rule: Risk > 15 Pts ⟹ 1 Contract
News Window: 15 Min Total Lockdown (Red Folders)
THE IMPACT THEORY PHASE VII

CHAPTER 7:
SOMATIC CALIBRATION

EXECUTION PSYCHOLOGY & EMOTIONAL DETACHMENT
CHAPTER 07 // SOMATIC CALIBRATION PART 7.1

The "Buy Data" Framework

When you take a loss on a setup that satisfied all confluence rules, you did not "lose money." You purchased a premium data point.

A professional poker player does not tilt when pocket aces get cracked; they know math compounds over 1,000 hands. A stopped-out trade is simply the necessary operating cost of running an algorithmic trading enterprise.

The Dopamine Reset: Before opening charts, your mind must be flat. No phones, no external noise. Spiked dopamine destroys the clinical patience required to wait for extreme vector nodes.

Post-Trade Audit: Review if price magnetized to CE, if news locks were honored, and if stops were kept safely off raw vector lines.

PSYCHOLOGY SOMATIC CALIBRATION CHECKLIST
Pre-Session State: Zero Dopamine Spikes (Flat Mind)
Loss Perspective: Data Point Purchase (1/1000 Distribution)
Patience Anchor: Execute Strictly at +/-2.0 to 4.5 SD Nodes
Journaling: Mandatory Daily Boundary Audit Log
THE IMPACT THEORY PHASE VIII

CHAPTER 8:
THE FRICTION TRAP

THE SOVEREIGN MATRIX ARCHITECTURE & WAR ROOM ENGINE
CHAPTER 08 // THE FRICTION TRAP PART 8.1

The Sovereign Solution

You now possess the foundational blueprints of the Impact Theory. However, manual daily execution introduces severe operational friction: 45 minutes of daily pre-market calculations, mathematical coordinate errors, and attention fatigue.

The Sovereign Solution: The Impact Boundary Matrix
We engineered this entire mathematical framework directly into a proprietary, automated TradingView engine.

⚡ 0-MINUTE OPERATIONAL FRICTION

The Matrix automatically tracks historical levels, projects standard deviations, and plots execution boundaries 24/7 in real time without manual charting.

TELEMETRY // MATRIX V4.2 INSTITUTIONAL SPEC
// SOVEREIGN MATRIX TELEMETRY SPEC Engine Version: Sovereign v4.2 Institutional Mathematical Base: True Volatility SD + Anchored Volume Active Arrays: • Central Equilibrium (CE) • Boundary Vectors (BV-R1..R3 / BV-S1..S3) • Clearance Vectors (CV-R1..R5 / CV-S1..S5) Friction Reduction: Eliminates 45m Daily Pre-Market Math Deployment: TradingView Invite-Only (War Room Access)
SOVEREIGN ACCESS PROTOCOL WAR ROOM TERMINAL
UPGRADE TO SOVEREIGN ACCESS
Join the Impact War Room & Unlock the Boundary Matrix